
Database Management
The management interface centralises all your isotopic data. It allows you to monitor the integrity of your database, obtain a global analytical overview of your measurement campaigns and manage the lifecycle of each sample.
Dashboard and Statistics
Main navigation
→
Database tab
The Database tab provides a consolidated view in the form of an interactive dashboard. IsoFind processes your data in real time to extract scientific performance indicators.
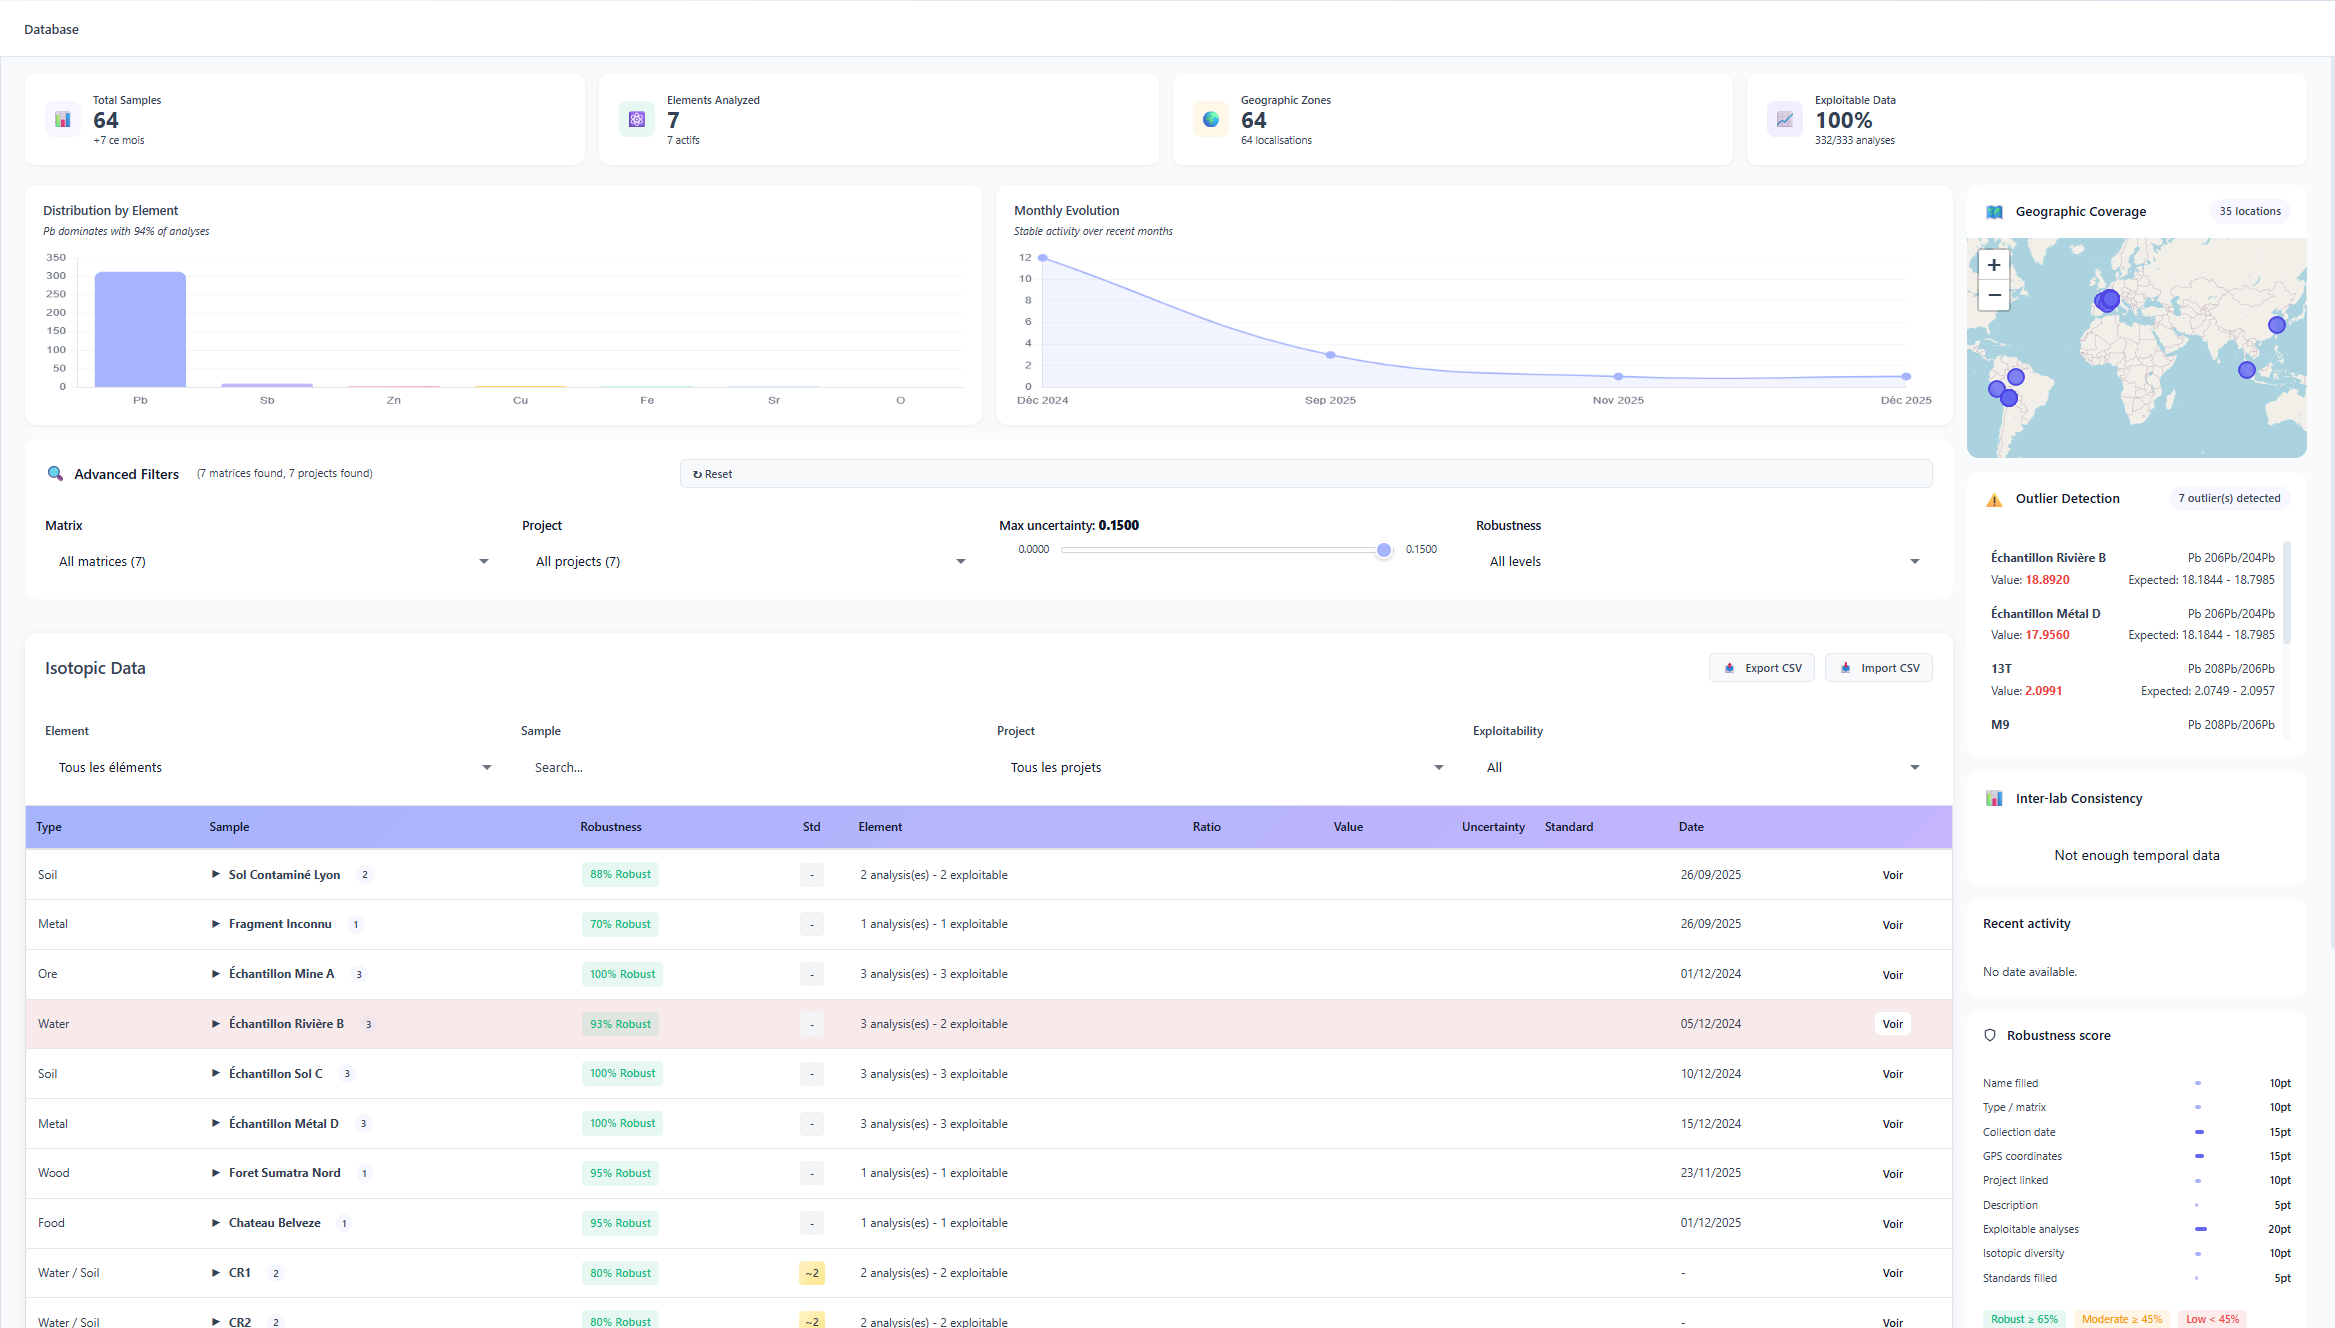 Figure 1: Overview of the database dashboard.
This control panel allows you to instantly visualise:
- Data volume: breakdown by number of samples and diversity of analysed elements.
- Geographic coverage: map of registered sampling zones.
- Usability status: ratio between validated samples and unusable samples (incomplete or inconsistent data).
Quality Control and Scientific Integrity
Two complementary mechanisms guarantee the integrity of your database throughout imports and manual entries.
Outlier detection
IsoFind automatically identifies data points that deviate statistically from expected signatures. This detection allows measurement errors or potential contaminations to be isolated without having to manually scan thousands of rows.
Detection is based on configurable criteria: maximum uncertainty threshold, deviation from the group median, inter-element consistency. Flagged samples remain viewable and editable — they are not automatically deleted.
Duplicate detection
The duplicate detection tool compares names, GPS coordinates and collection dates to identify potentially redundant entries. Detected duplicates are presented in pairs, with the option to merge them or keep them separate if the measurements are legitimately distinct.
Reliability Indicators: the Robustness Score
For each registered sample, IsoFind automatically calculates a robustness score. This score is not a binary validation but a weighted analysis of the scientific quality of the data, composed of three dimensions:
Score composition
Metadata: completeness of the record (GPS coordinates, collection date, operator).
Analytical quality: consistency of isotopic values and level of measured uncertainties.
Integrity: absence of duplicates or entry inconsistencies.
Metadata: completeness of the record (GPS coordinates, collection date, operator).
Analytical quality: consistency of isotopic values and level of measured uncertainties.
Integrity: absence of duplicates or entry inconsistencies.
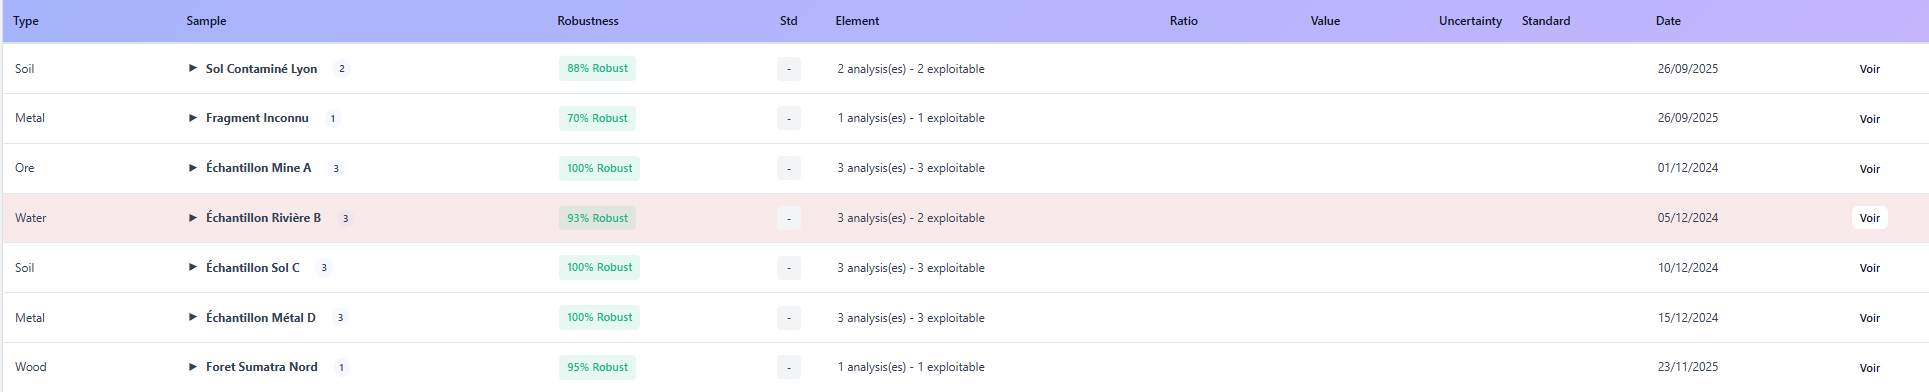 Figure 2: Data table with robustness score indicators.
Scores are visualised via colour-coded badges (green, orange, red) for immediate identification. Samples deemed unusable are automatically highlighted.
Standardisation and Normalisation
The Norm column is a critical indicator for the inter-laboratory comparability of your data. It specifies the relationship between the analysed sample and its isotopic reference standard.
| Symbol | Meaning |
|---|---|
| N | Normalised: the sample has been corrected against a reference standard. |
| R | Reference: the sample is itself a reference standard or is already on the absolute scale. |
| ! | Alert: no reference standard is attached to this sample. |
| ? | Unknown: the defined standard is not listed in the local database. |
Detailed Measurement Inspection
Clicking on a row in the table expands a contextual panel without leaving the main view.
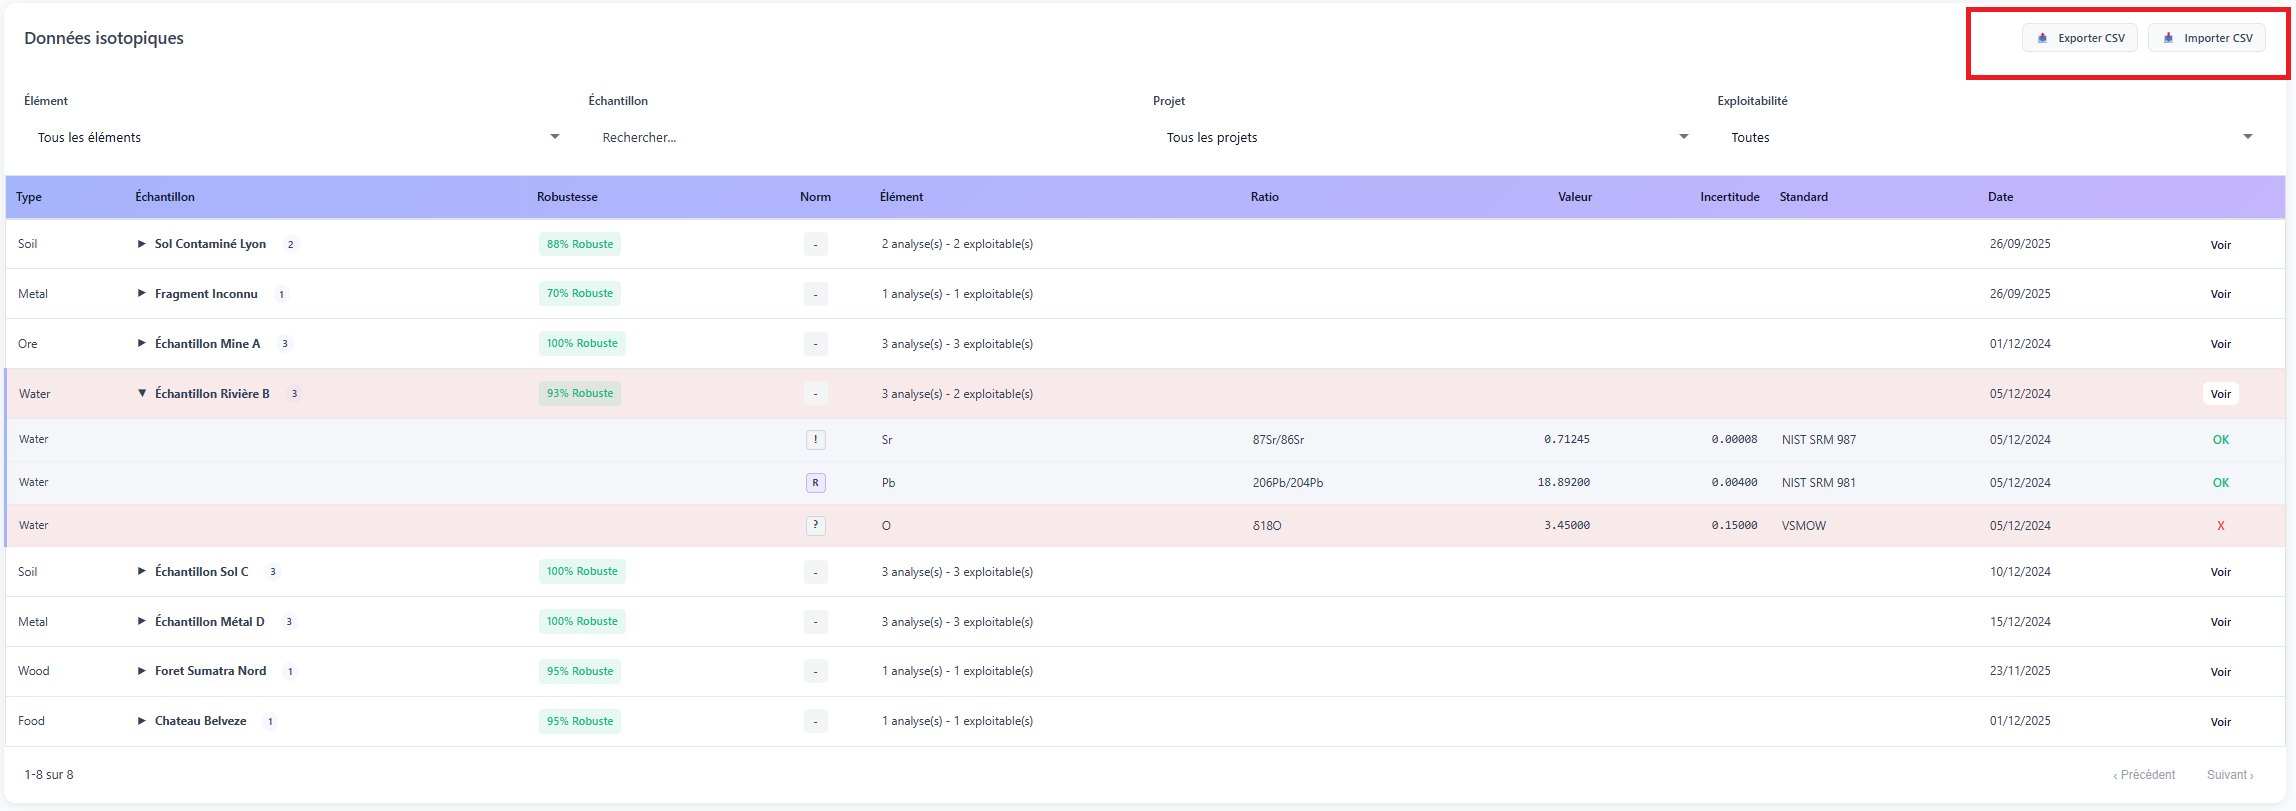 Figure 3: Expanded view of isotopic ratios for a sample.
In the example above (Figure 3), the sample is marked as unusable. The details panel reveals that the exclusion stems from an excessively high statistical uncertainty on one of the critical ratios, rendering the isotopic signature unusable for precise provenance calculation.
Adding a Sample Manually
For importing large volumes (CSV, Excel or .isof files), see the Importing Data page. For a single entry:
Data
→
Add a sample
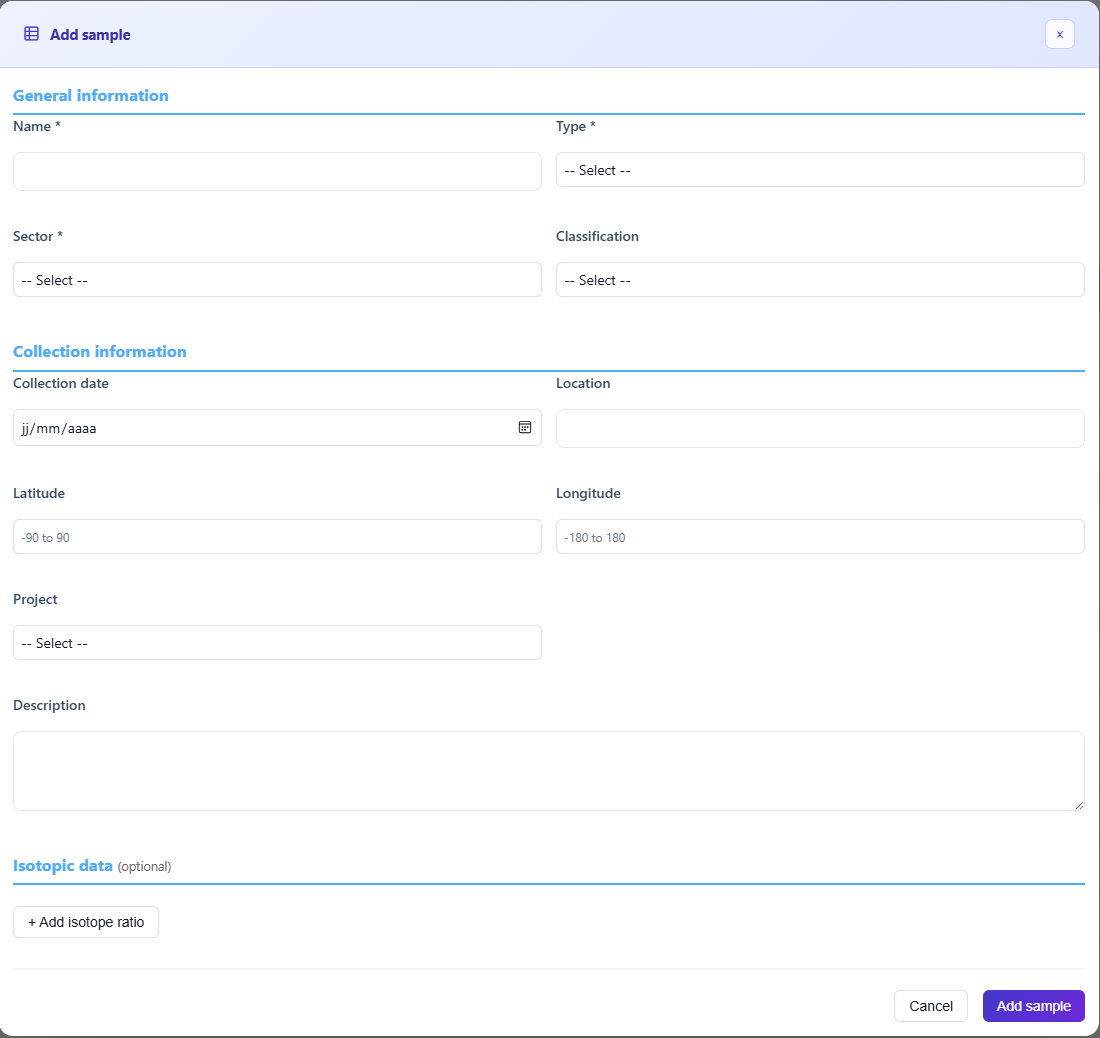 Figure 4: Sample record creation form.
Only the Name field is required. The robustness score will be higher the more complete the metadata (GPS, date, operator) is.
Multi-ratio entry
IsoFind allows an unlimited number of measurements to be linked to a single sampling point. The Add an isotopic ratio button expands new element-specific fields, making it possible, for example, to simultaneously record a ratio for the aqueous phase, one for sediments and one for suspended matter at the same site.
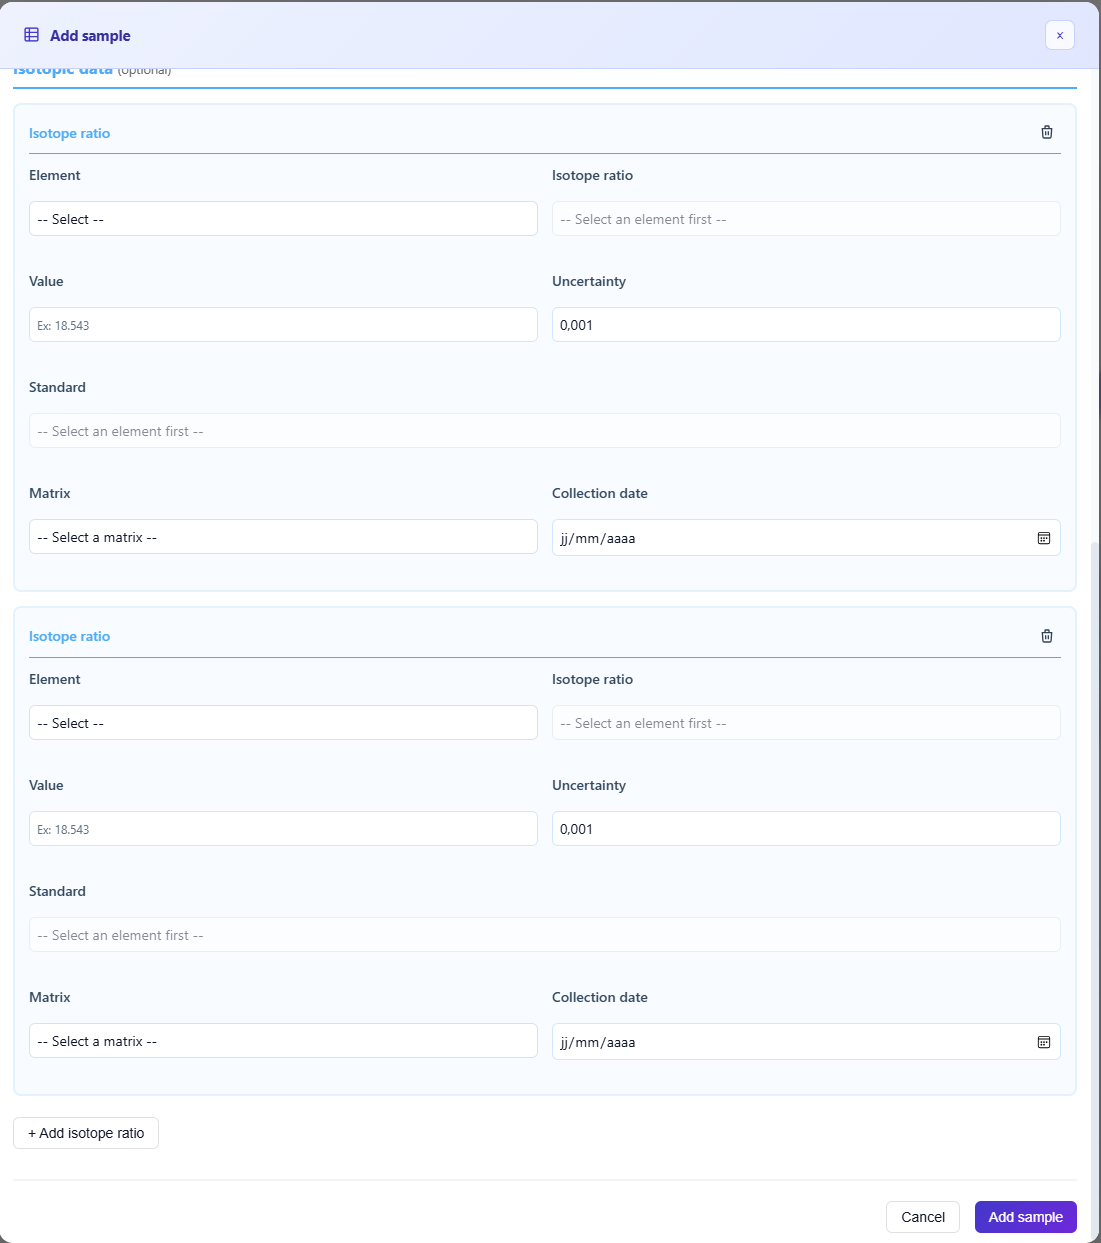 Figure 5: Ratio and analysis matrix configuration interface.
Sample Management
Data
→
Manage samples
This menu centralises routine maintenance operations on a specific sample:
- View sample properties instantly.
- Duplicate or delete an entry.
- Enrich the data by adding a new isotopic ratio.
- Export a selection in .csv or .isof format.
- Archive the data to the archive database.
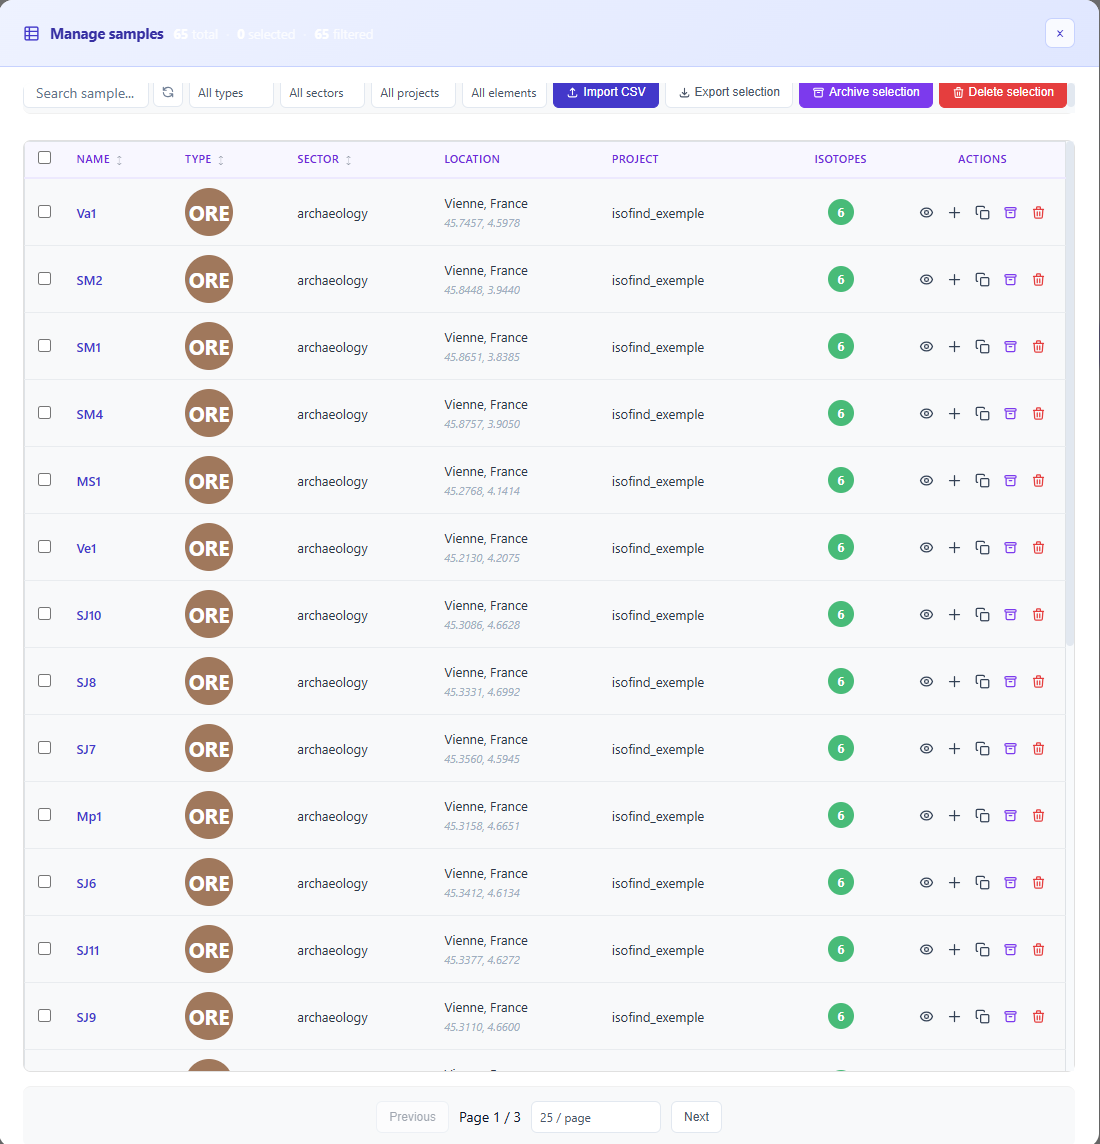 Figure 6: Sample management context menu.
Editing and Traceability
All values in the database can be completed or corrected. Clicking the View button in the main table opens the detailed view of the sample.
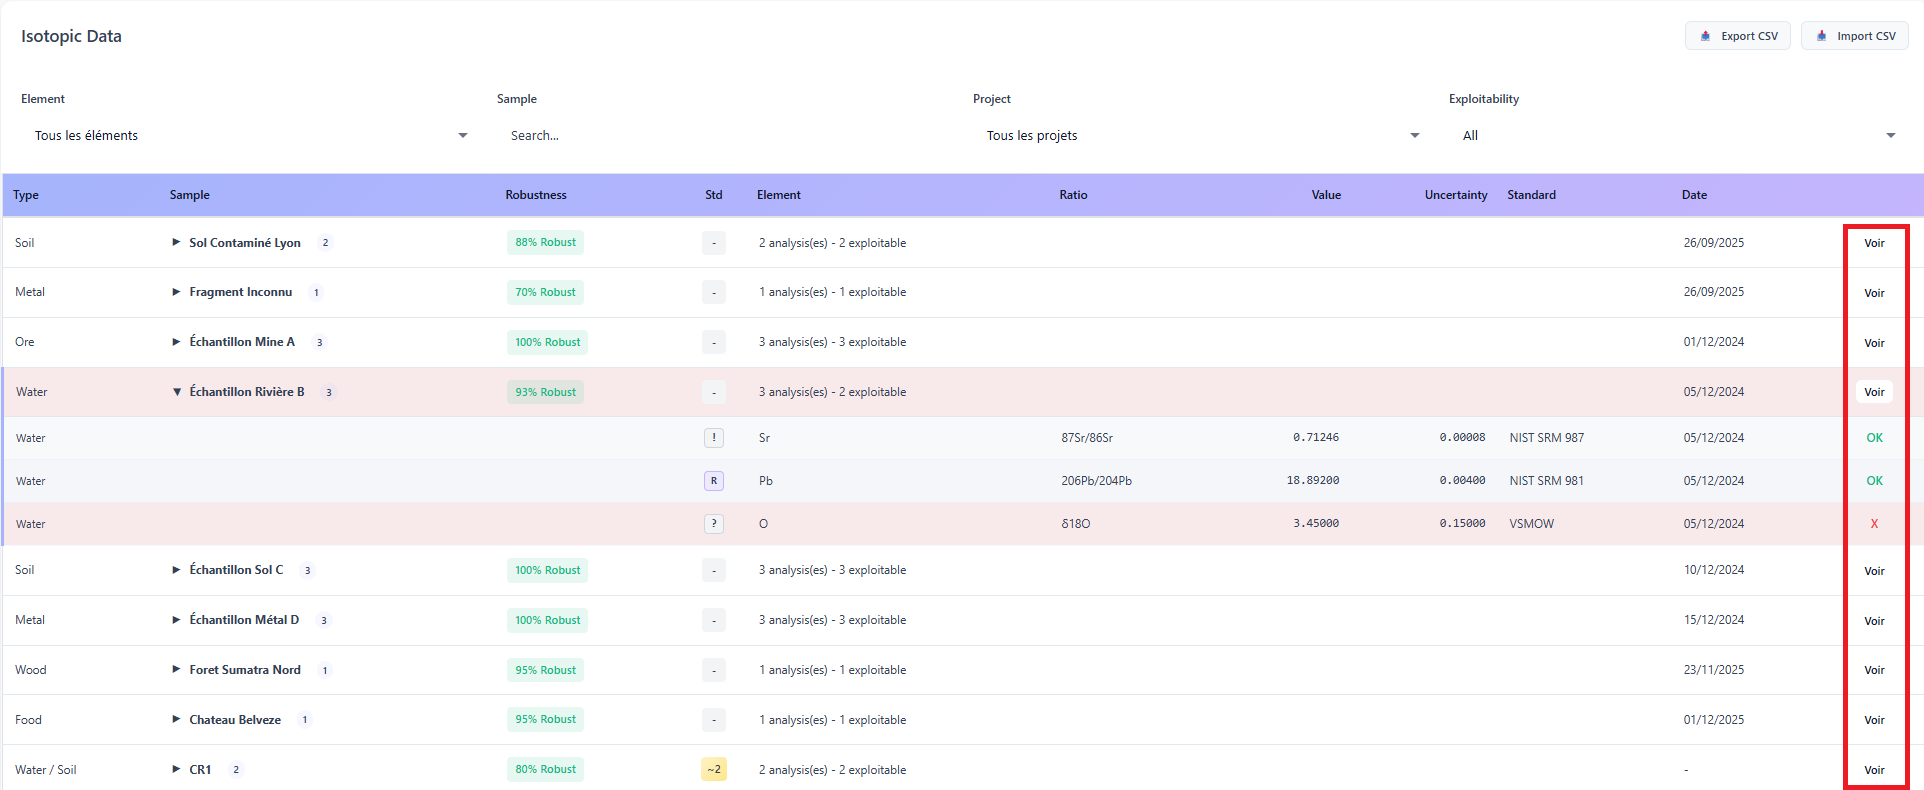 Figure 7: Accessing detailed inspection.
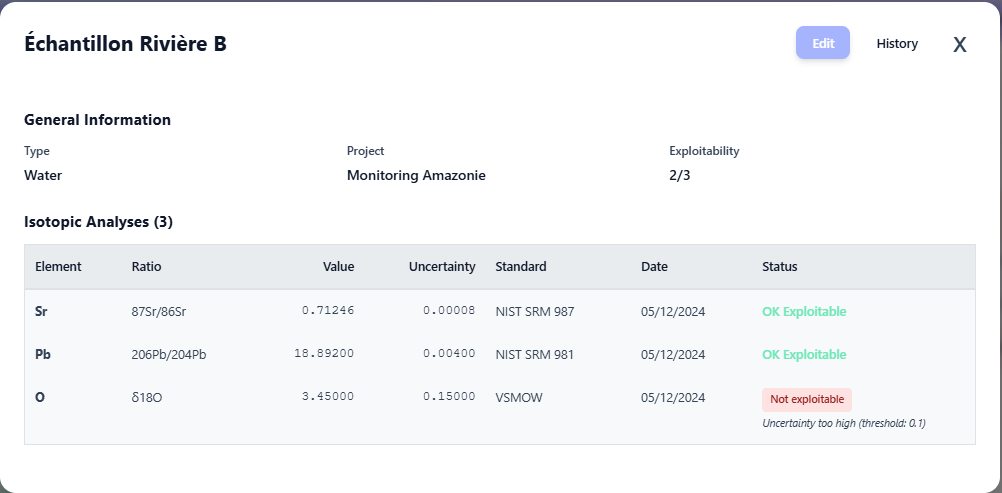 Figure 8: Detailed view of sample properties.
The Edit button (top right) opens a modal window to update the required fields.
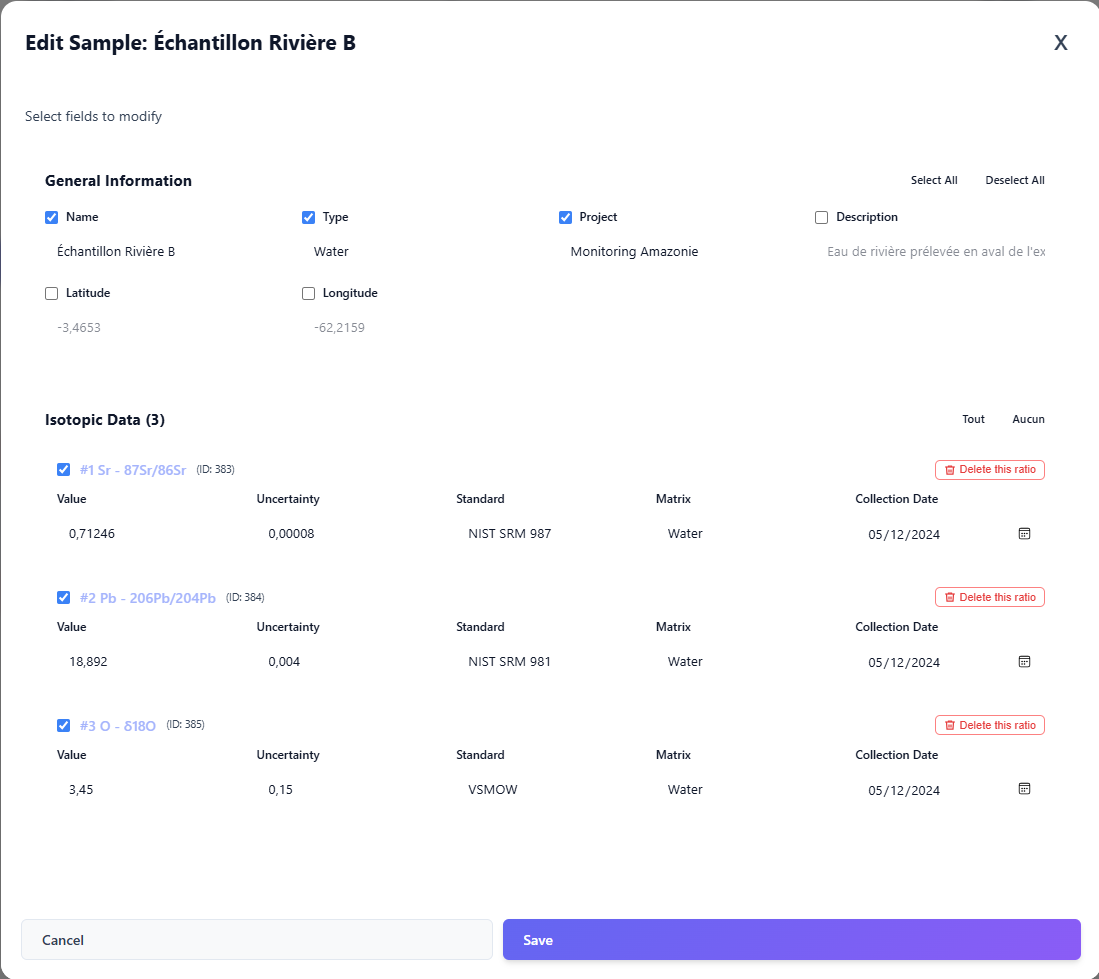 Figure 9: Editing interface.
In accordance with scientific traceability requirements, every modification is recorded in the audit log. IsoFind archives the old value, the new value and the timestamp of the action.
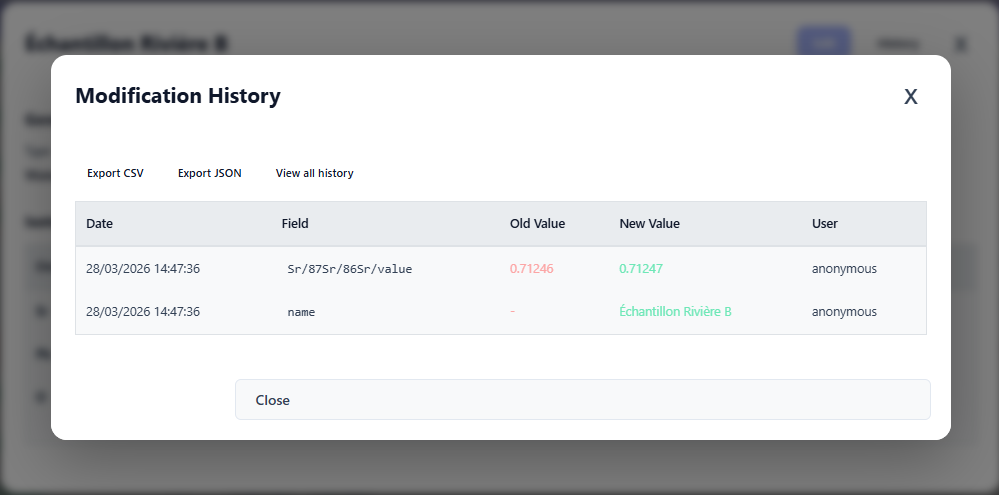 Figure 10: Audit log and modification history.
Material Normalisation
Over successive imports, spelling variants accumulate in the material type field (ore vs Ore vs minerai). Normalisation groups these variants under a single canonical term, directly improving the quality of filters and correspondence searches.
Data
→
Database
→
Normalise materials
Normalisation is non-destructive: raw data is preserved and variants are simply remapped to the canonical term. The operation is reversible from the audit log.
Database Cleanup
The cleanup operation removes orphaned entries, analytical sessions with no associated measurements and references to standards that are no longer in use. It frees up space without affecting sample data.
Data
→
Database
→
Clean up
Cleanup is irreversible. Perform a database backup before any cleanup operation. See Backup and Restore the Database.
Deletion
Samples can be deleted individually or in bulk.
Any deletion via the trash icon is permanent. The data, associated ratios and traceability history are permanently erased from the SQLite database.
Individual deletion: use the trash icon in the relevant sample's menu.
Bulk deletion: check the selection boxes in the main table, then click the delete button at the top of the list.
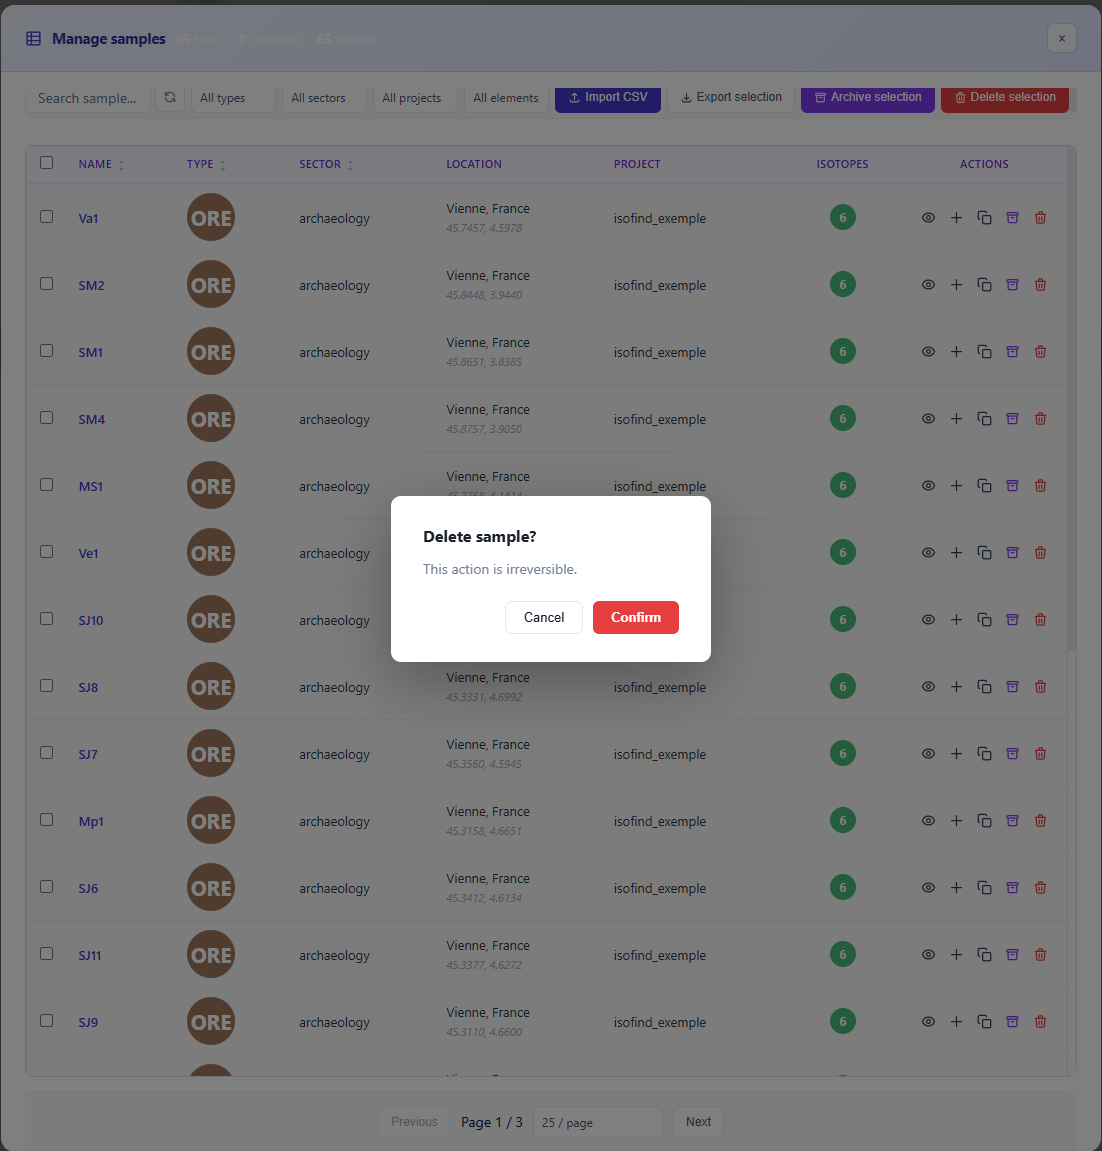 Figure 11: Deletion confirmation.
If you simply want to remove a sample from your current analyses while retaining a record, use the Archive function rather than deleting. Archived data remains viewable and restorable at any time.
Archiving and Restoration
The archiving system is designed to handle large volumes (several tens of thousands of entries) without degrading the responsiveness of the main interface. Archived samples are excluded from the active database statistics, ensuring that indicators remain relevant to your current projects at all times.
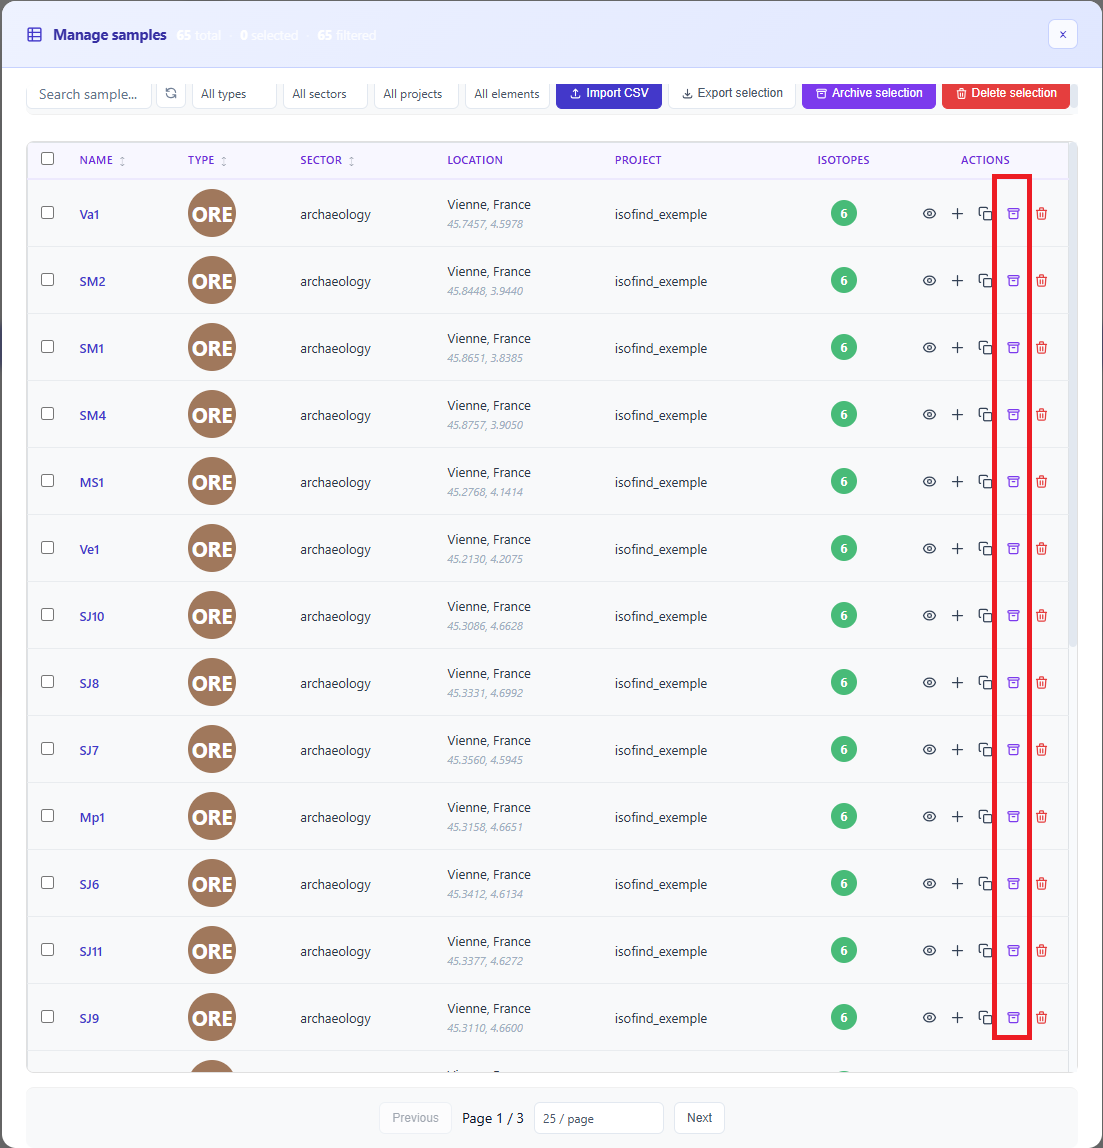 Figure 12: Sample archiving controls.
Archives remain accessible and fully reversible:
Data
→
View archives
From this screen you can view the details of an archived sample, restore it to the active database, or permanently delete it.
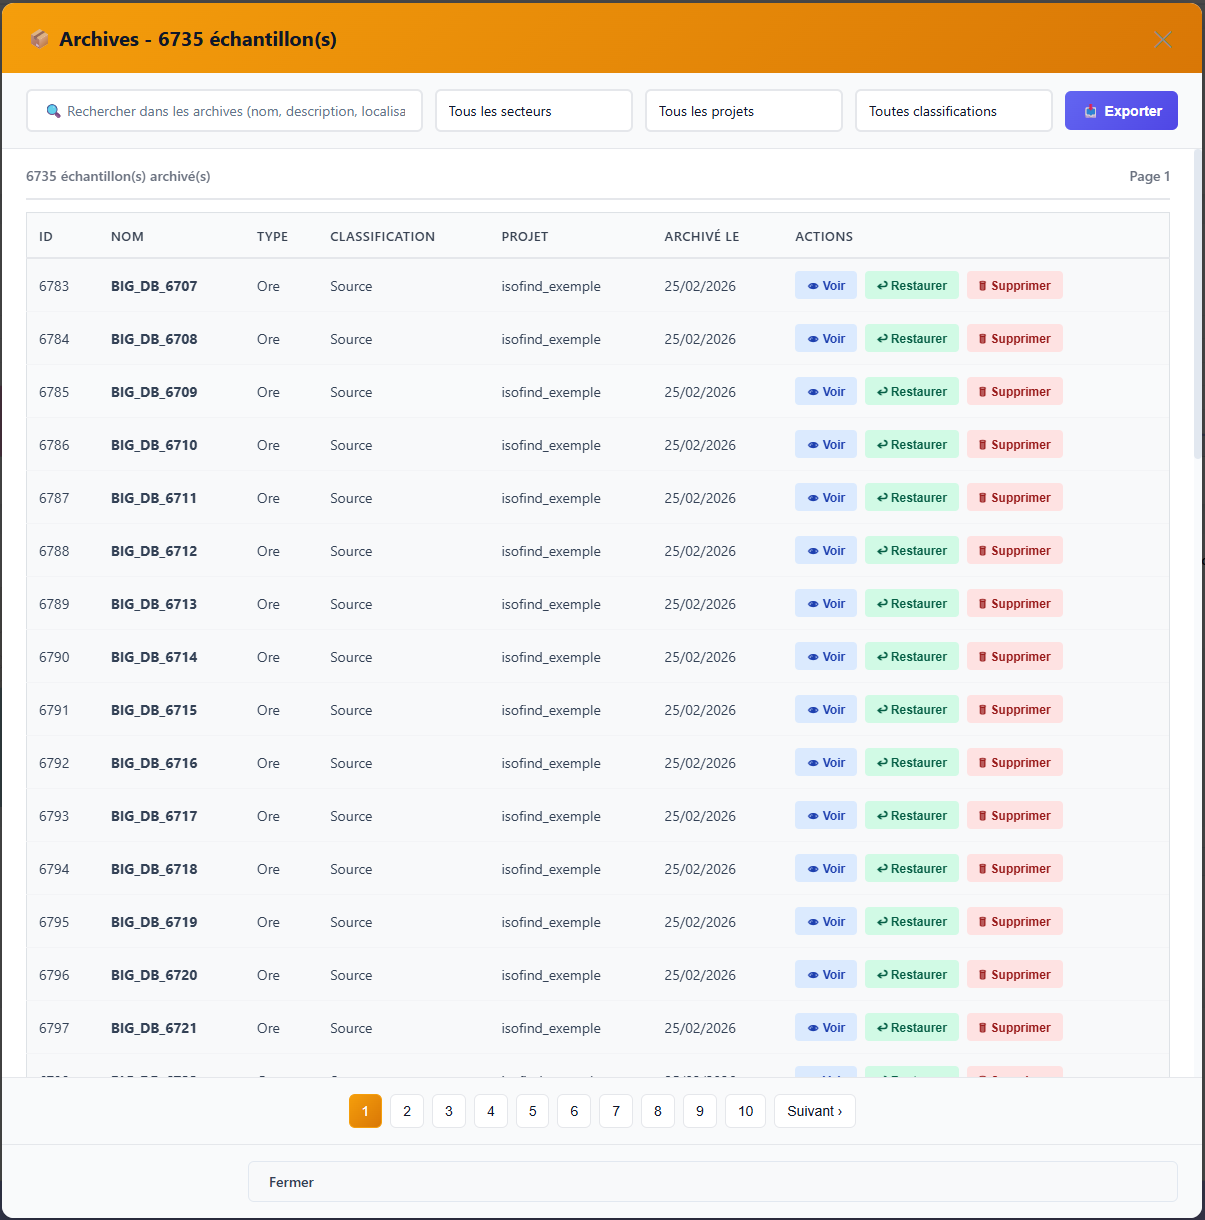 Figure 13: Archive management console.
Archives are not a sealed compartment. They remain searchable during geographic correspondence searches, allowing new samples to be compared against historical signatures without prior restoration.