Saturday, 25 July, 2026
Reading the Results
The results panel (right column, fixed 340px) centralizes the analytical synthesis. This page explains how to interpret each element displayed after clicking Update Analysis.
Triggering the Analysis
Configuration Panel
→
Update Analysis (bottom of panel)
| Button State | Meaning |
|---|---|
| Check icon + "Analysis Up to Date" | Backend available. Results calculated using the full reference database. |
| Spinner + "Backend Analysis..." | Request in progress to POST /api/prospection/analyse. Typical duration < 2 s. |
| Disabled button + license message | energy_mining license inactive. The results panel displays the restriction message. |
| Client-side calculation (Degraded mode) | Backend unavailable. Charts recalculated locally; deposit matches are absent. |
The Global Score
Displayed at the top of the results panel, from 0 to 100, with an uncertainty range (min score / max score).
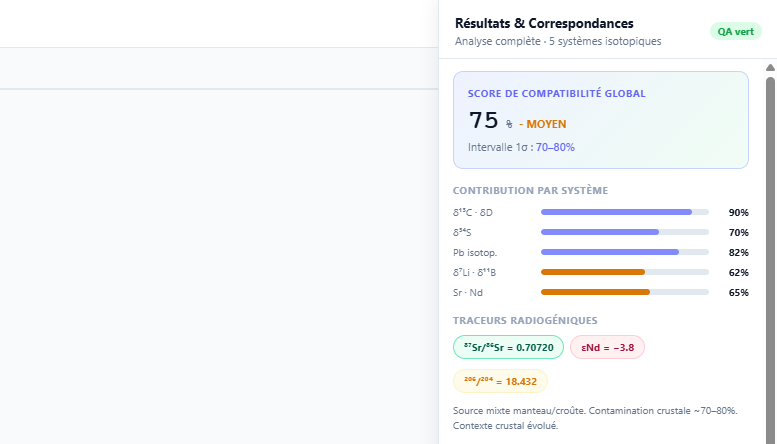 Figure 1: Global score with uncertainty range. Contributions per system are displayed below the main value.
Applied weighting (weights are renormalized if a system is missing):
| Contribution | Weight | Calculated From |
|---|---|---|
| Organic Maturity (δ13C) | 25 % | Confidence level of the identified stage (High=0.90 / Medium=0.75 / Low=0.55) |
| δ34S Distality | 20 % | Baseline deviation in sigma units, capped at 1.0 |
| Isotopic Lead | 20 % | Consistency of the estimated crustal fraction |
| Lithium (δ7Li / [Li]) | 25 % | Salar potential score normalized to 100 |
| Sr / Nd | 10 % | Geochemical source consistency (fixed value of 0.65 if provided) |
A score of 85 calculated on a single system (Li only) is less robust than a score of 70 calculated across four systems. Always check the number of active contributions displayed below the score.
The Maturity Profile
The Estimated Tmax is the central point of the range for the identified stage. It is used to calculate the fractionation factors displayed at the bottom of the panel. Example for a dry_gas stage, Kerogen II (Tmax ≈ 480 °C):
- SO₄aq–H₂Saq: Δ ≈ 14.3 ‰ (database a, b, c factors, calculated at T = 480 + 273.15 K)
- CO₂–CH₄: Δ ≈ 18.7 ‰
- quartz–H₂O: Δ ≈ 4.5 ‰
Deposit Matches
Up to 8 matches are returned, sorted by descending Gaussian score. Only deposits with an agreement ≤ 3σ on at least one shared system are included.
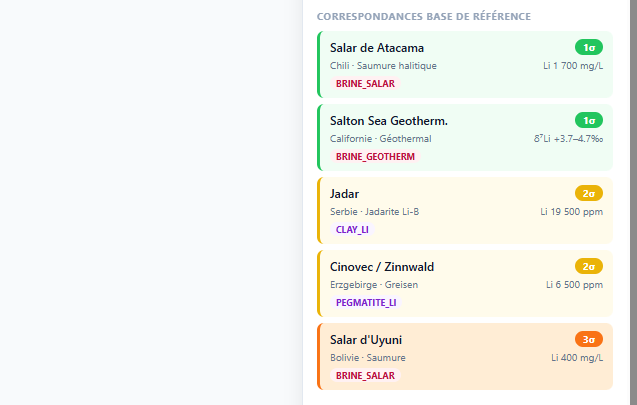 Figure 2: Match Cards. The left border color indicates the sigma agreement level. Each card displays the name, country, deposit type, score, and number of compared systems.
| Color | Sigma Level | Meaning |
|---|---|---|
| ■ Green | 1σ - score ≥ 0.95 | The measurement falls within the central range of the reference deposit. |
| ■ Amber | 2σ - score 0.68 – 0.95 | Probable match at 95%. |
| ■ Orange | 3σ - score 0.40 – 0.68 | Possible match. To be confirmed by other systems. |
A strong match indicates isotopic similarity to a known deposit, not genetic certainty. Local geology, tectonics, and field data remain indispensable.
Calculated Fractionation Factors
At the bottom of the results panel, 7 priority phase pairs are displayed, calculated at the estimated Tmax. The formula applied is:
Δ = a × 10⁶ / T² + b × 10³ / T + c (T in Kelvin)
Priority pairs displayed by default:
| Pair | System | Valid T | Δ @ 200 °C | Δ @ 300 °C |
|---|---|---|---|---|
| SO₄aq–H₂Saq | δ34S | 100–600 °C | +28.3 ‰ | +19.1 ‰ |
| anhydrite–H₂Saq | δ34S | 100–400 °C | +26.8 ‰ | +18.3 ‰ |
| pyrite–galena (geotherm.) | δ34S | 150–500 °C | +4.6 ‰ | +3.1 ‰ |
| quartz–H₂O (geotherm.) | δ18O | 200–600 °C | +11.7 ‰ | +6.9 ‰ |
| calcite–H₂O (geotherm.) | δ18O | 0–350 °C | +5.7 ‰ | −1.0 ‰ |
| CO₂–CH₄ (geotherm.) | δ13C | 0–700 °C | +50.9 ‰ | +34.7 ‰ |
| fluid–muscovite | δ7Li | 25–500 °C | +8.5 ‰ | +5.6 ‰ |
If the estimated Tmax falls outside a pair's validity range, the field in_range: false is returned by the API, and the value is displayed in italics with a warning in the interface.
Session Number
After each successful analysis, the session number is visible in the title bar (e.g., Session #42). See Analysis Sessions to retrieve and export results.