Saturday, 25 July, 2026
Hydrothermal Distality
The Distality Vectors tab measures the distance of a sample from a hydrothermal source. It combines sulfur deviation from a regional baseline with lead isotopy to identify the source reservoir, two complementary tools for vectoring toward mineralized zones.
When to Use This Tool?
- You have measured δ34S on sulfides or sulfates and want to evaluate whether the signature is distal (near the sedimentary baseline) or proximal (marked hydrothermal signature).
- You have Pb isotopic ratios and want to identify if the lead source is mantle-derived, lower crustal, or upper crustal according to the SK75 or ZD81 models.
- You are looking for an isotopic vector to guide exploration toward the core of a mineralized system.
Chart 1: δ34S IDW Map
The map uses IDW (Inverse Distance Weighting) interpolation on a 60 × 40 grid to represent the δ34S deviation relative to the selected regional baseline.
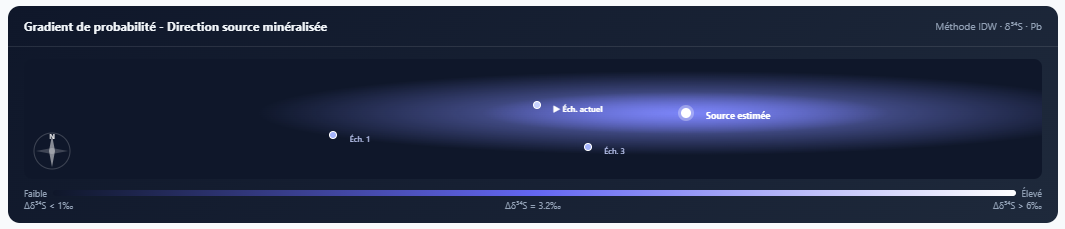 Figure 1: δ34S IDW Map. Warm gradient = strong positive deviation (proximal to hydrothermal source). Cold gradient = near sedimentary baseline (distal).
Chart 2: Deviation in Sigma Units
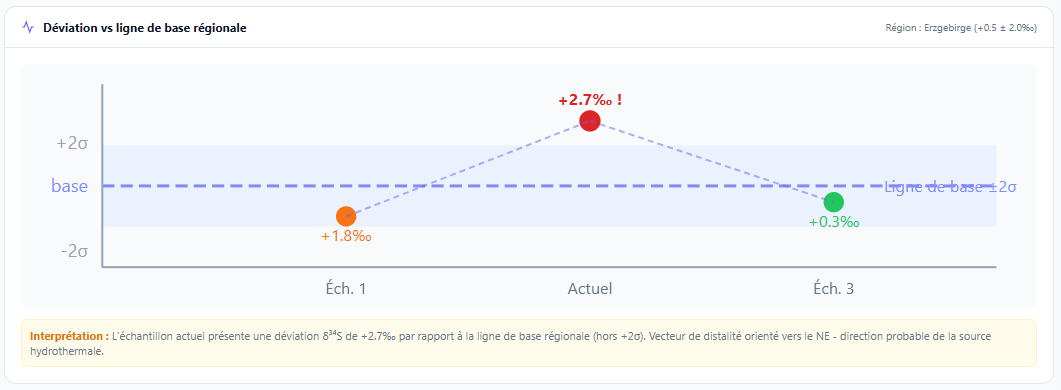 Figure 2: δ34S deviation in sigma units. A deviation > 2σ is considered a significant hydrothermal anomaly.
Rule of thumb: a deviation > 2σ justifies vectoring toward the source. A deviation > 3σ indicates a dominant hydrothermal contribution. Below 1σ, the signature is indistinguishable from the regional baseline.
Selecting the Correct Regional Baseline
The database contains 59 baselines spread across 14 geological regions. Selection is made in the Distality section of the configuration panel. Documented δ34S baselines are listed below:
| Region | Country | Central δ34S (‰) | σ |
|---|---|---|---|
| Erzgebirge (Ore Mountains) | Germany / Czechia | +0.5 | 2.0 |
| Massif Central | France | +2.0 | 3.0 |
| Armorican Massif | France | +1.0 | 2.5 |
| Central Bohemian Massif | Czechia / Germany | +2.0 | 3.0 |
| Western Alps | France / Italy / Switzerland | +3.0 | 4.0 |
| Pyrenees | France / Spain / Andorra | +8.0 | 6.0 |
| Iberian Pyrite Belt (IPB) | Spain / Portugal | +2.5 | 2.5 |
| Aegean Basin | Greece / Turkey | +2.5 | 4.0 |
| Carpathians and Foreland | Romania / Poland / Slovakia | +3.0 | 5.0 |
| Fennoscandian Shield | Norway / Sweden / Finland | +0.5 | 1.5 |
| Caledonides (Norway-Sweden) | Norway / Sweden | +2.0 | 3.0 |
| Paris Basin | France | +22.0 | 4.0 |
| Zechstein Basin (North Sea) | Netherlands / Germany / Denmark | +18.0 | 5.0 |
The Paris Basin (+22 ‰) and Zechstein (+18 ‰) regions have high values because they incorporate marine evaporite signatures. Only use these if your field site is in this specific context—otherwise, your "deviation" will be falsely negative.
If your region is not in the list, manually enter a central value and σ in manual mode. Regions are named by tectonic unit, not by country.
Essential Sulfur Kinetic Fractionations
The database includes 3 documented kinetic processes for δ34S, whose real values influence interpretation:
| Process | Kinetic ε (‰) | Geological Context |
|---|---|---|
| BSR (Open System) | −2 to −42 ‰ (central −25) | Anoxic marine sediments, MVT, peripheral SEDEX. Highly variable by bacterial species. |
| BSR (Closed System - Sulfate Limited) | −2 to −25 ‰ (central −15) | Confined anoxic basins. When sulfate is depleted, H₂S δ34S rises toward source SO₄ δ34S. |
| TSR (Thermochemical Reduction) | −10 to −30 ‰ (central −20) | Oil reservoirs, SEDEX, MVT in evaporites. Temperature controlled. |
Chart 3: Isotopic Pb (SK75 / ZD81)
Reservoir evolution curves are calculated in real-time from radioactive decay constants (λ₂₃₈, λ₂₃₅). Two models are implemented in the database:
| Model | Reservoirs | μ (²³⁸U/²⁰⁴Pb) |
|---|---|---|
| Stacey-Kramers 1975 (SK75) | Stage 1: 4,570 → 3,700 Ma (μ = 7.19) / Stage 2: 3,700 Ma → present (μ = 9.74) | 7.19 / 9.74 |
| Zartman-Doe 1981 - Mantle | Depleted mantle (MORB-type) | 7.55 |
| ZD81 - Lower Crust | Intermediate μ | 8.46 |
| ZD81 - Upper Crust | Highly radiogenic Pb. SEDEX-prone. | 11.38 |
| ZD81 - Orogene | Crustal/Mantle mixture. Most SEDEX. | 9.74 |
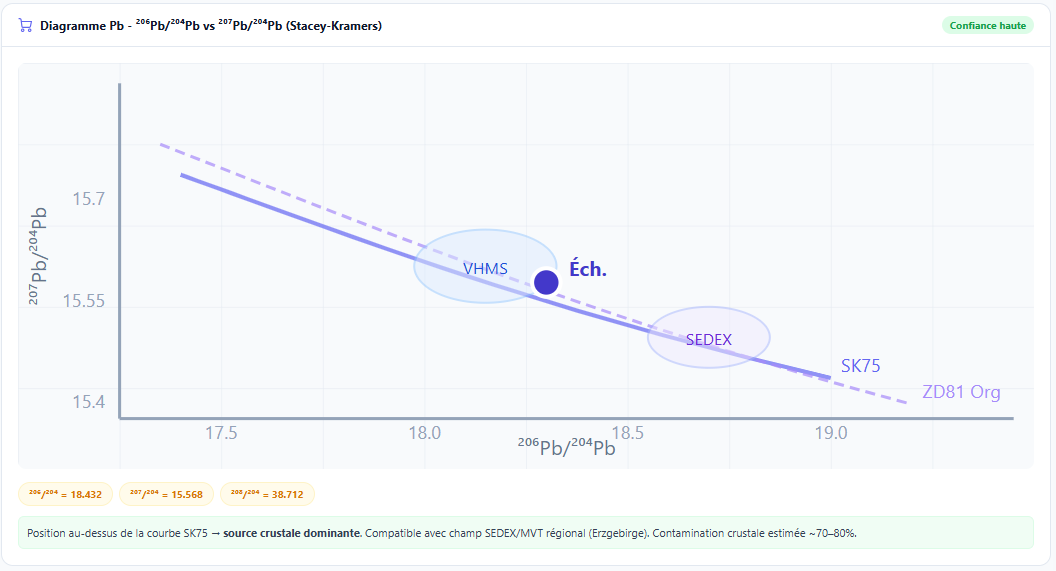 Figure 3: Isotopic Pb Diagram. SK75 (2 stages) and ZD81 (5 reservoirs) curves are calculated in real-time from radioactive constants. The crustal fraction is estimated by interpolation between ZD81 Upper Crust and Mantle.
Interpreting Point Position
| ZD81 Position | Estimated Crustal Fraction | Associated Deposit Type |
|---|---|---|
| On or below mantle curve | < 25 % | MORB, oceanic basalts, rifting-associated deposits |
| Between Mantle and Lower Crust | 25 – 50 % | Island arcs, active margins, Cu-Au porphyries |
| Between Lower Crust and Orogene | 50 – 75 % | Phanerozoic VHMS, skarn, epithermal |
| Above Orogene curve | > 75 % | SEDEX, MVT, deposits with strong sedimentary component |
The database contains Pb baselines for 14 regions (206Pb/204Pb for 8 regions, 207Pb/204Pb for 6, 208Pb/204Pb for 5). Example: Massif Central, France - central 206Pb/204Pb = 18.70 (σ = 0.4); Erzgebirge - central 207Pb/204Pb = 15.70 (σ = 0.05). These baselines allow for calculating deviation from regional background, complementing the SK/ZD models.
Practical Cases
My δ34S is very negative (−15 ‰ or less)
A highly negative value signals marked bacterial sulfate reduction (BSR)—a typically distal signature. In open-system BSR, kinetic ε can reach −42 ‰. These values are common in SEDEX (McArthur River central δ34S = +16 ‰ in mineralized levels, but host sulfides can drop to −15 ‰) and low-temperature deposits.
I only have one Pb ratio
SK/ZD projection in 206/204 vs 207/204 space requires at least two ratios. With only one (e.g., only 206Pb/204Pb), the module calculates a rough estimate of the crustal fraction without plotting the point on the 2D diagram.
My point is significantly above the Upper Crustal curve
Highly radiogenic Pb indicates either an ancient crustal source (cratonic) or a local anomaly linked to secondary concentration. MVT deposits and some Paleozoic SEDEX regularly show this type of signature (e.g., Sullivan, Red Dog above the ZD81 orogenic curve).