Saturday, 25 July, 2026
Organic Maturity
The Organic Maturity tab is used to determine the thermal evolution stage of organic matter within a sedimentary basin, define the hydrocarbon generation window, and estimate Tmax without requiring a directly measured Ro. It relies on 18 maturity stages covering kerogen types I, II, IIS, and III, compiled from over 20 peer-reviewed publications.
When to Use This Tool?
- You have analyzed drilling gases (δ13C CH₄ and/or δD CH₄) and want to determine if you are in the oil, condensate, or dry gas window.
- You lack a direct Ro measurement and wish to estimate it via isotopic inversion from δ13C CH₄.
- You want to visualize your sample's position within the Schoell genetic gas space to distinguish biogenic gas from thermogenic gas.
Required Data
| Field | Unit | Required For |
|---|---|---|
| δ13C CH₄ | ‰ V-PDB | Maturity window + Schoell diagram |
| δD CH₄ | ‰ V-SMOW | Schoell diagram only |
| Measured Ro | % | Optional - takes priority over δ13C inversion if provided |
| Kerogen Type | I / II / IIS / III / IV | Maturity window (conditions the reference frame) |
| Uncertainties (1σ) | ‰ | Error ellipses on charts |
Chart 1: Maturity Window (δ13C vs. Ro)
This diagram crosses the measured δ13C CH₄ value with the vitrinite reflectance (Ro). Colored envelopes delineate the maturity stages for the selected kerogen type.
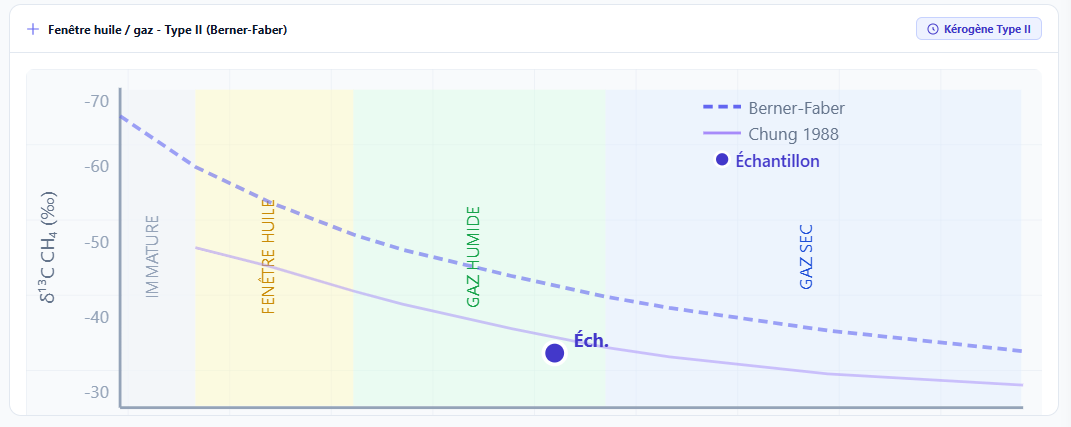 Figure 1: Maturity window for Kerogen II. The blue point represents the sample. The colored envelopes delineate the immature, early_oil, peak_oil, wet_gas, and dry_gas stages.
Maturity Stages - Kerogen II (Marine Reference)
The ranges below represent the reference database for Type II (marine kerogen, the most documented). The δ13C CH₄ and δD CH₄ ranges are derived from 28 reference signatures each.
| Stage (Database) | Ro (%) | Tmax (°C) | δ13C CH₄ (‰) | δD CH₄ (‰) | Product |
|---|---|---|---|---|---|
| immature | 0.0 – 0.5 | < 430 | −80 to −50 | −250 to −180 | None |
| early_oil | 0.5 – 0.8 | 430 – 435 | n.d. | n.d. | Heavy oil |
| peak_oil | 0.8 – 1.0 | 435 – 445 | −50 to −40 | −215 to −155 | Light oil |
| wet_gas | 1.0 – 1.8 | 445 – 465 | −45 to −35 | −200 to −145 | Wet gas + Condensate |
| dry_gas | 1.8 – 3.5 | 465 – 500 | −40 to −28 | −175 to −130 | Dry methane |
For Type III kerogen (humic, gas-prone) and Type IIS (sulfur-rich), the Ro ranges are shifted toward lower values. Type IIS enters the generation window as early as Ro = 0.4% (peak_oil stage between 420 and 435 °C). Select the exact type to ensure correct envelopes are displayed on the chart.
δ13C → Ro Inversion (Without Measured Ro)
When Ro is not provided, the module estimates Ro from δ13C CH₄ using a Newton iterative inversion based on the boundaries of the kerogen_maturity table for the selected type. The relationship used is not a single analytical formula; rather, the module identifies the stage where the δ13C range brackets the measured value.
The returned confidence level is:
- High - if measured Ro is provided directly.
- Medium - if the stage is identified via δ13C inversion.
- Low - if no δ13C range covers the value ("undetermined" stage).
The immature stages for types I, III, and IV do not currently have δ13C ranges defined in the database—they can only be identified via Ro. If you are in a lacustrine (Type I) or coal (Type III) context without measured Ro, the confidence will consistently be low for these early stages.
Chart 2: Schoell Diagram (δ13C vs. δD)
This diagram crosses δ13C CH₄ and δD CH₄ to distinguish the genetic origin of natural gases. It requires both values to be entered.
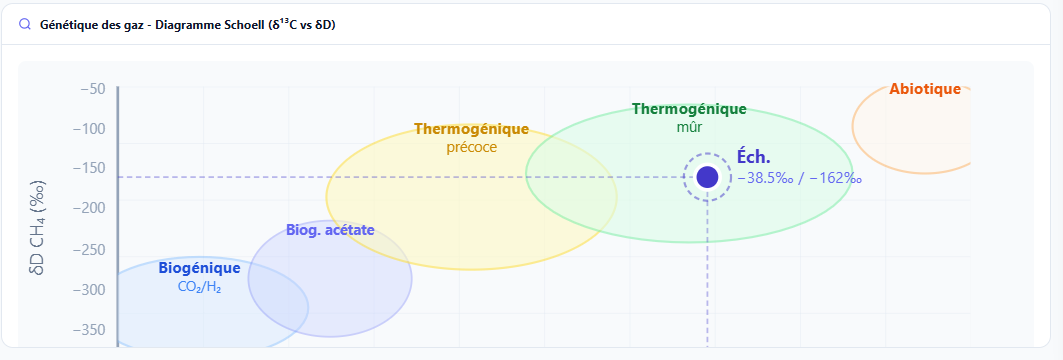 Figure 2: Schoell Diagram. The five zones delineate the primary genetic origins of natural gases. The error ellipse (blue) is plotted based on the 1σ uncertainties entered.
The Five Genetic Zones
| Zone | δ13C CH₄ (‰) | δD CH₄ (‰) | Interpretation |
|---|---|---|---|
| Biogenic (mixed immature) | −110 to −55 | −400 to −250 | Bacterial methanogenesis. Highly negative δ13C. Shallow deposits, swamps, peatlands. |
| Early Thermogenic (early_oil) | −50 to −40 | −215 to −155 | Start of Type II kerogen thermal cracking. Oil + nascent associated gas. |
| Peak_oil / wet_gas | −50 to −35 | −215 to −145 | Main generation window. Wet gas + condensate. |
| Thermogenic Dry Gas (dry_gas) | −40 to −28 | −175 to −130 | Over-mature kerogen, Ro 1.8–3.5%. Residual methane from secondary cracking. |
| Mixed Gas (mixed dry_gas) | −30 to 0 | −150 to −80 | Biogenic/thermogenic mixture or contribution from multiple sources. Interpret with caution. |
A point positioned at the intersection of two zones indicates a mixture of sources or post-migration alteration. Complementary analyses (C₂/C₁ ratio, i-C₄/n-C₄) are recommended to reach a conclusion.
What the Results Panel Displays
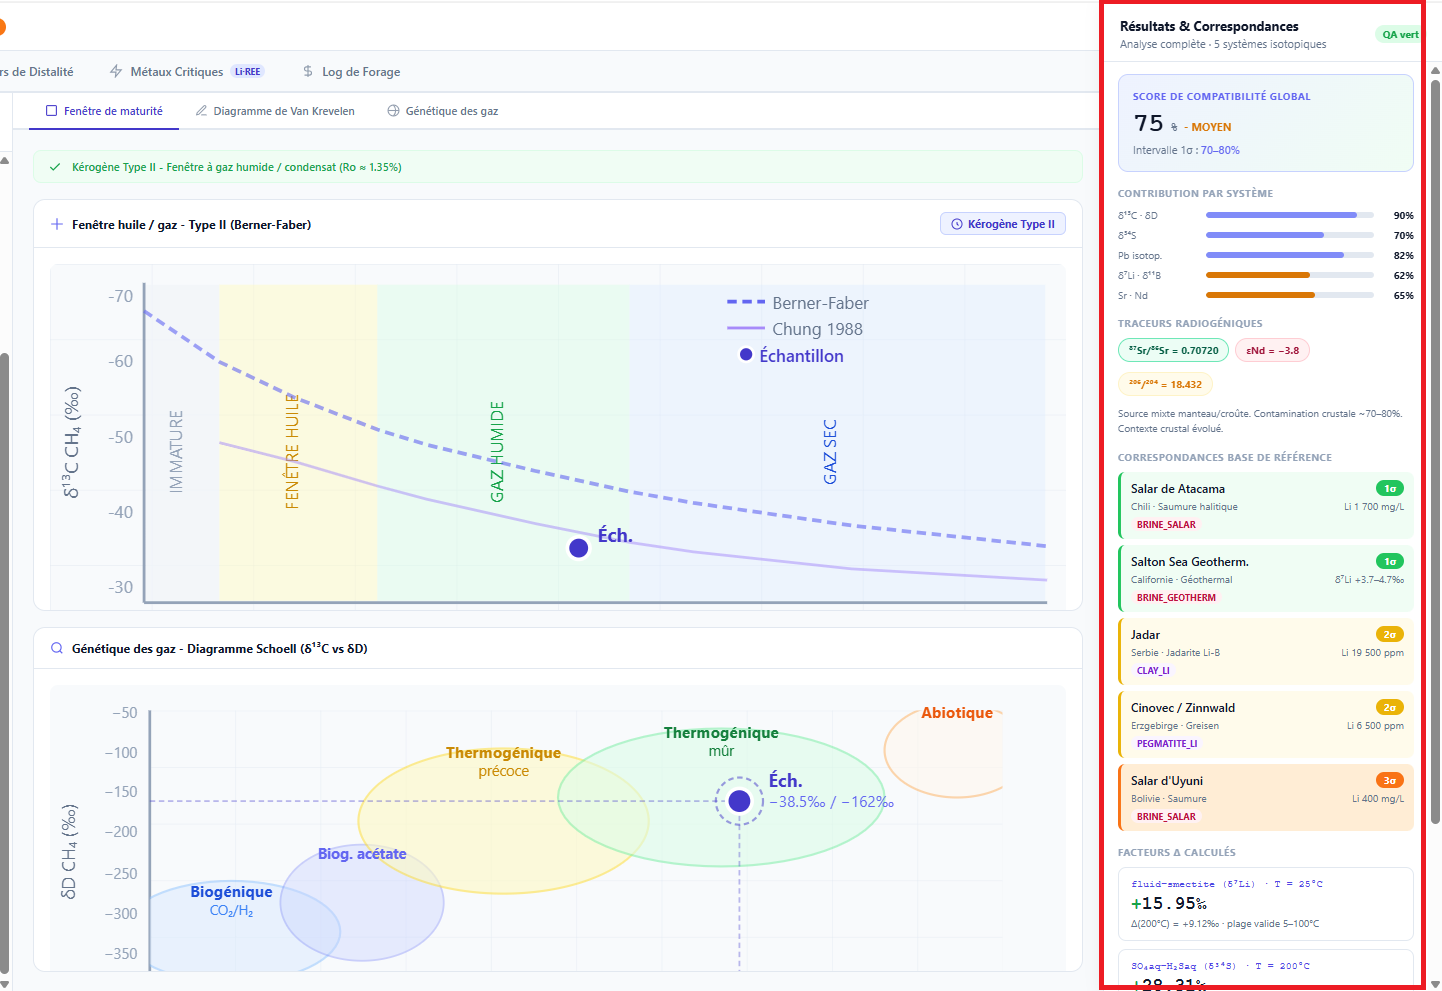 Figure 3: Maturity datasheet in the results panel. Identified stage, Ro range, estimated Tmax, product type, and confidence level.
The Estimated Tmax (central point of the range) is directly used to calculate the mineralogical fractionation factors displayed at the bottom of the results panel. For a Type II sample in the dry_gas stage (Tmax ≈ 480°C), the calculated factors will be, for example:
- SO₄aq–H₂Saq: Δ ≈ 14.3 ‰ (at 480°C, based on database polynomial coefficients)
- quartz–H₂O: Δ ≈ 4.5 ‰ (at 480°C)
- CO₂–CH₄: Δ ≈ 18.7 ‰ (at 480°C)
Common Practical Cases
I only have δ13C CH₄, no δD
Only the maturity window chart will be displayed. The Schoell diagram remains empty. You will still obtain a stage, an estimated Tmax, and oil deposit matches.
My point is outside all envelopes
Check the units (V-PDB for carbon, V-SMOW for deuterium) and the kerogen type. If the value is correct, the module returns "undetermined" with low confidence—this is typical for Type IV (inertinite) or non-thermogenic gas (e.g., volcanic gas).
I want to change the kerogen type during analysis
Modify the selector in the Maturity section of the configuration panel. The chart envelopes will update immediately without restarting the backend analysis.