Friday, 10 July, 2026
Provenance Traceability Along a Custody Chain
The Quick Detection module, Provenance Traceability tab, traces the transformation chain of a raw material from its current state (concentrate, refined metal, alloy) back to the geological deposit of origin, by reversing the effects of the applied industrial processes.
The Problem This Tab Solves
A batch of refined antimony metal arrives at customs with a declaration of Bolivian origin. But the impurity content and microstructure are compatible with Chinese production. How to confirm this isotopically, given that refining has shifted the original isotopic signature by approximately −0.15 to −0.30‰ depending on the process used?
Provenance traceability solves this problem by modelling known industrial processes and applying them in reverse. For each declared or assumed process in the chain (smelting, acid leaching, electrolysis), IsoFind calculates what signature the deposit of origin would have needed to produce the measured output signature. It then compares this recalculated signature against deposits registered in the database.
This is precisely what conventional chemical analyses cannot do: they measure a final composition but cannot trace back along a quantified transformation chain.
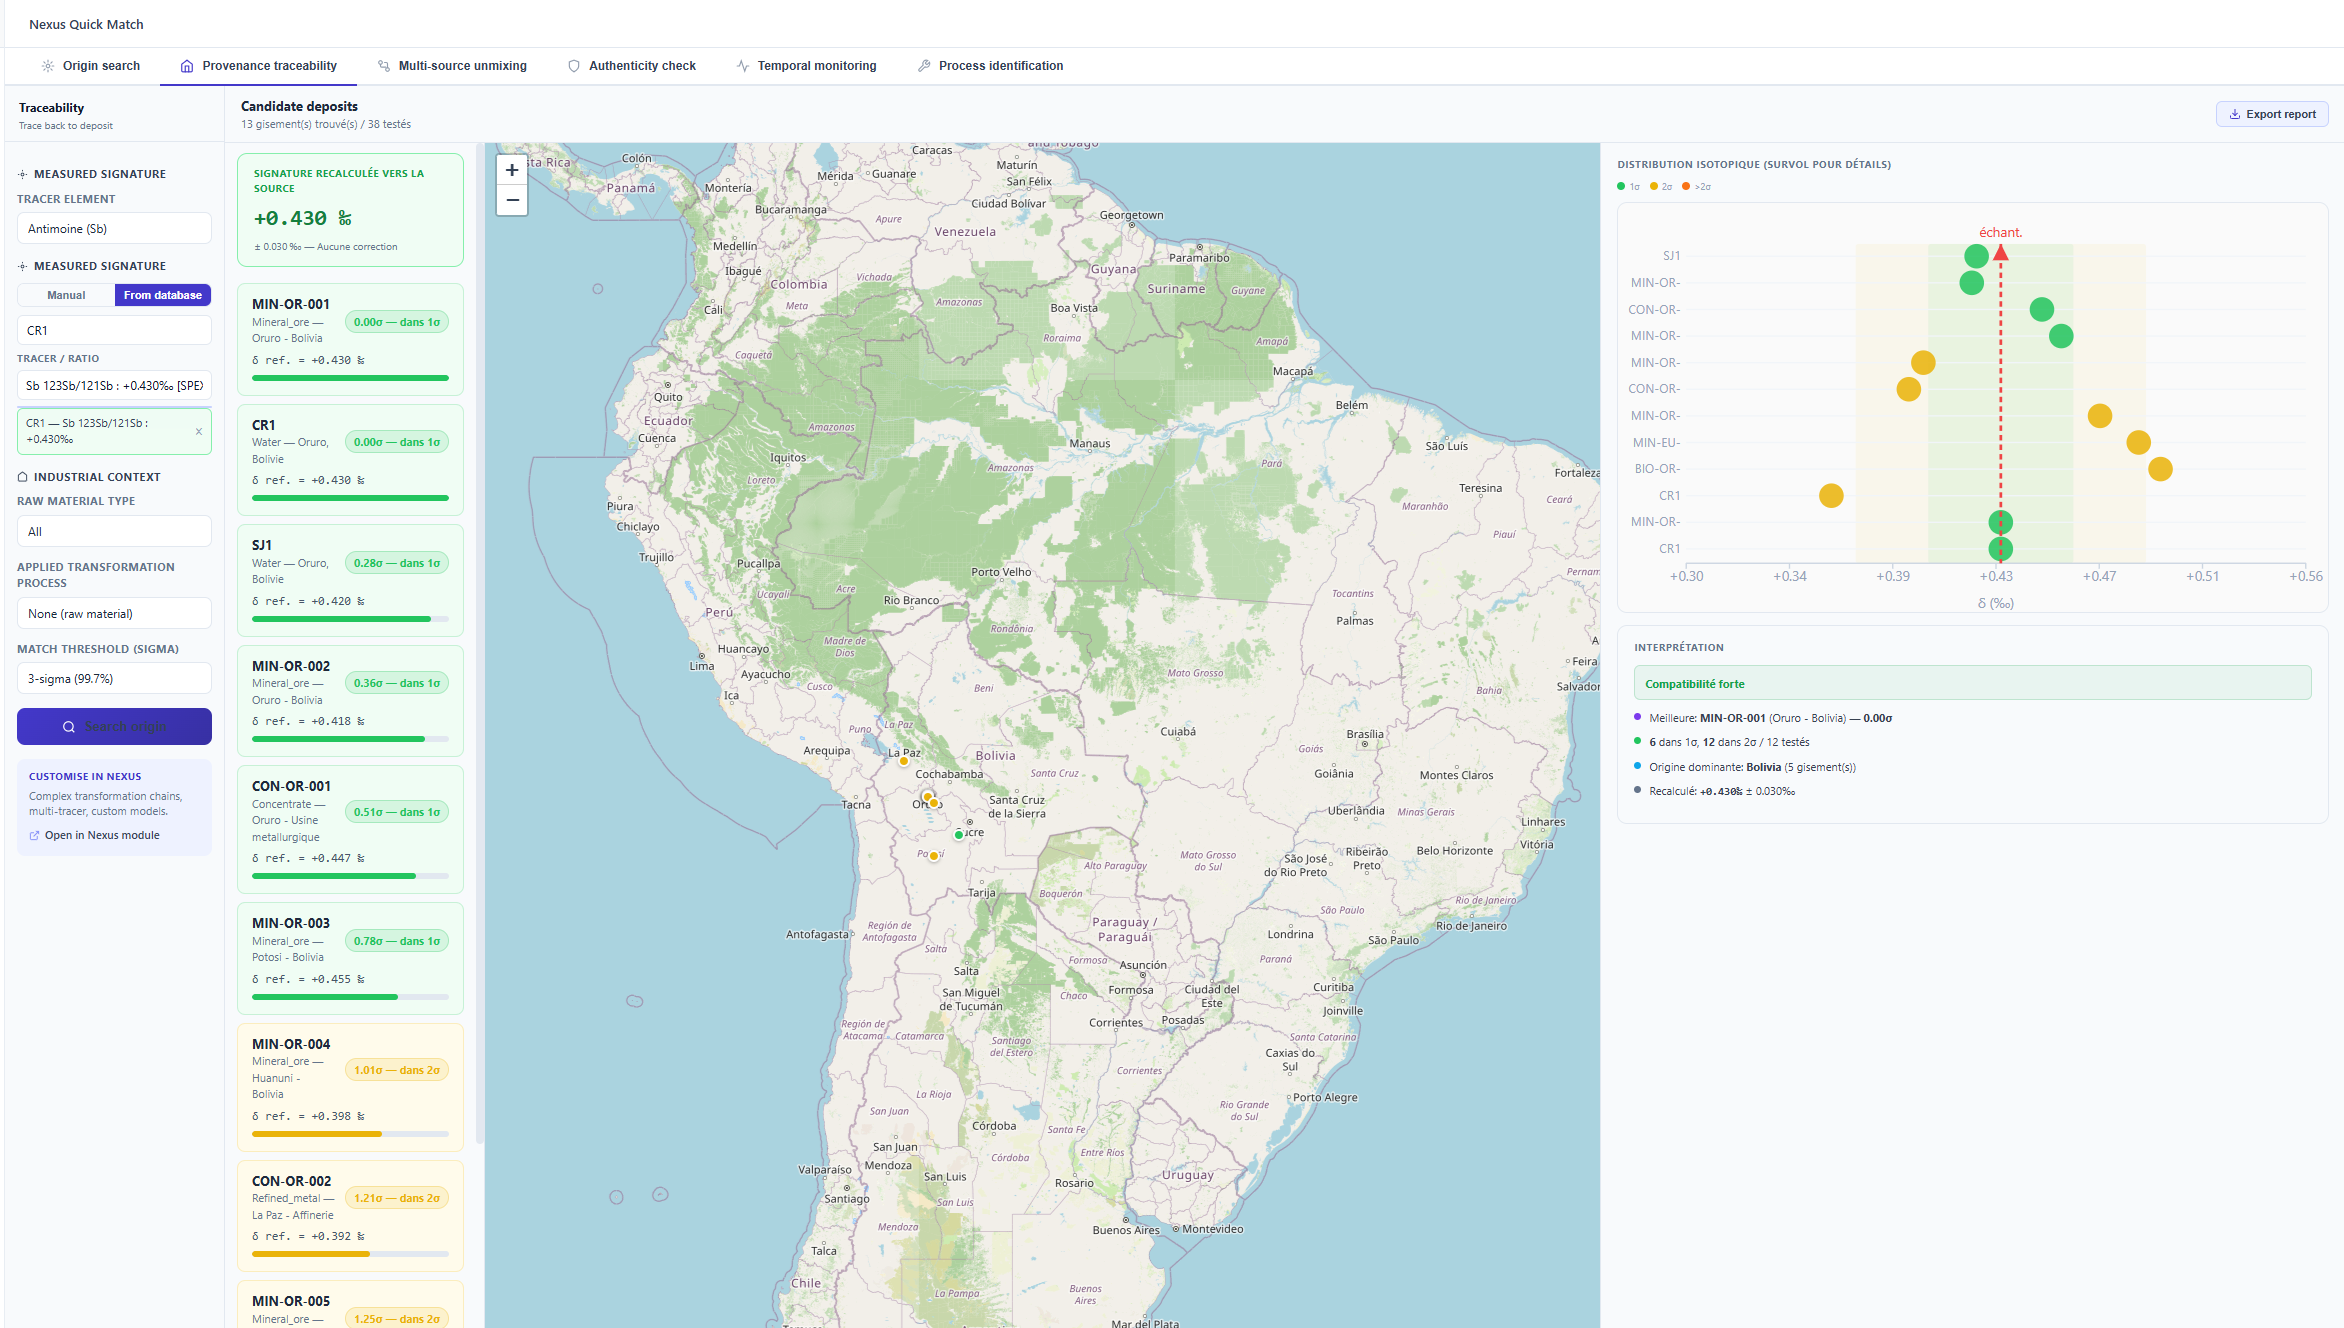 Figure 1 : Main traceability search screen.
Difference from the Origin Search Tab
Both tabs share the same process-inversion logic, but address different contexts.
| Origin Search | Provenance Traceability | |
|---|---|---|
| Contexte | Environmental, forensic | Industrial, customs, supply chain |
| Processus modélisés | Natural (adsorption, redox, dissolution) | Industrial (smelting, leaching, electrolysis) |
| Type de matière | Waters, sediments, soils, rocks | Concentrates, refined metals, alloys, chemical products |
| Base de référence | Environmental samples and primary sources | Mining deposits, certified reference concentrates |
Modelled Industrial Processes
Each industrial process induces a documented isotopic fractionation. IsoFind models them with their mean ε values and uncertainties, derived from the scientific literature and laboratory experimental data.
| Process | Mean ε (‰) | Application |
|---|---|---|
| Pyrometallurgy / Smelting | −0,30 ± 0,10 | Smelting of sulphide ores, production of Sb₂O₃ oxide |
| Hydromet. Leaching | +0,20 ± 0,08 | Extraction in acid solution (H₂SO₄, HCl) |
| Electrolysis | −0,15 ± 0,06 | Electrolytic refining, cathodic deposition |
| Chemical Precipitation | +0,25 ± 0,07 | Precipitation by NaOH, tartrate, caustic soda |
| Solvent Extraction | +0,10 ± 0,05 | SX/EW, MIBK, D2EHPA in the refining chain |
| Roasting | −0,35 ± 0,12 | Thermal oxidation of sulphides at 500–800°C |
These ε values are estimates based on available literature and IsoFind SAS experimental data for antimony. They may vary depending on specific operating conditions (temperature, acidity, charge purity). For legal or regulatory expert studies, it is recommended to characterise the ε values specific to the facility concerned and enter them manually in custom mode.
Step-by-Step Workflow
-
Enter the Signature of the Transformed Product Enter the δ value and analytical uncertainty of the analysed concentrate, refined metal, or alloy. Where possible, use the same reference standard as that used for database data (NIST SRM 3102a for antimony).
-
Select the Raw Material Type Select the matrix type from the dropdown (raw ore, concentrate, refined metal, alloy, chemical product). This filter directs the search towards relevant references in the database.
-
Declare the Applied Transformation Process Select the main industrial process from the list. If several processes have been applied sequentially, use Custom mode to chain them or load a Nexus workflow from My Workflows. The order of processes in the chain matters: smelting always precedes leaching in a conventional antimony refining process.
-
Adjust the Sigma Threshold and Run Start at 3-sigma for a broad search. Reduce to 2-sigma to narrow down if the number of results is too high. Click Search for Origin.
Reading the Results Map
The main result is the back-calculated source signature: the δ value that the deposit of origin would have needed to produce in order to yield the measured signature, after applying the declared processes. This value is accompanied by its propagated uncertainty, which accounts for analytical uncertainties and uncertainties on the process ε values.
The geographic map overlaid on the results positions each candidate deposit on the world map. In customs traceability cases, this map is often the most communicative element for conveying conclusions to non-specialist audiences.
Provenance traceability is particularly effective with a multi-tracer approach. Combining δSb with δPb or δS drastically narrows the space of compatible deposits. A deposit matching on two independent tracers is far more likely to be the true source than a match on a single tracer.
Practical Case: Verification of an Antimony Trioxide Batch
A flame retardant manufacturer receives a batch of Sb₂O₃ declared of Bolivian origin. The measured value is δ¹²³Sb/¹²¹Sb = +0.392‰ ± 0.009. The declared manufacturing procedure includes oxidative smelting and alkaline leaching.
Configuration in the Quick Detection module:
- Element: Sb, δ = +0.392‰, uncertainty = 0.009
- Material type: refined metal
- Process: pyrometallurgy (ε = −0.30‰)
- Threshold: 3-sigma
Result: back-calculated source signature = +0.692‰ ± 0.104. The Bolivian deposits (Oruro, Potosí) show δ values of +0.40 to +0.47‰, incompatible at 3σ with the recalculated signature. In contrast, two Chinese deposits (Xikuangshan, Guizhou) show values of +0.65 to +0.72‰, compatible at 1σ. The declared Bolivian origin is refuted by the isotopic data.
Integration into a CRM Compliance Framework
Within the framework of the European Critical Raw Materials Act (CRM Act), isotopic provenance traceability constitutes a complementary analytical method alongside documentary declarations. IsoFind allows structuring these analyses into dedicated CRM projects, exporting them in LIMS JSON format for integration into compliance systems, and signing results with an accredited laboratory certificate in ISOF format.
See the Activating a Lab Certificate page for the procedures for signing and securely archiving expert analysis results.
Try this practical case
Download the Oruro confluence dataset to reproduce the unmixing analysis (24% AMD / 76% Agricultural).
- Download the .isof project (Recommended)
- Download the .csv dataset
These training datasets will be available with the Pro version.
Security note: these training files are provided in
.isof format and digitally signed (Level 2). Upon import, verify the certificate to confirm the official IsoFind origin.