Wednesday, 1 July, 2026
Mapping and Spatial Analysis
IsoFind's mapping module allows you to instantly visualise the spatial distribution of your isotopic signatures. It is an essential tool for identifying environmental gradients or validating the geographic provenance of a sample.
1. Interface and Dynamic Filtering
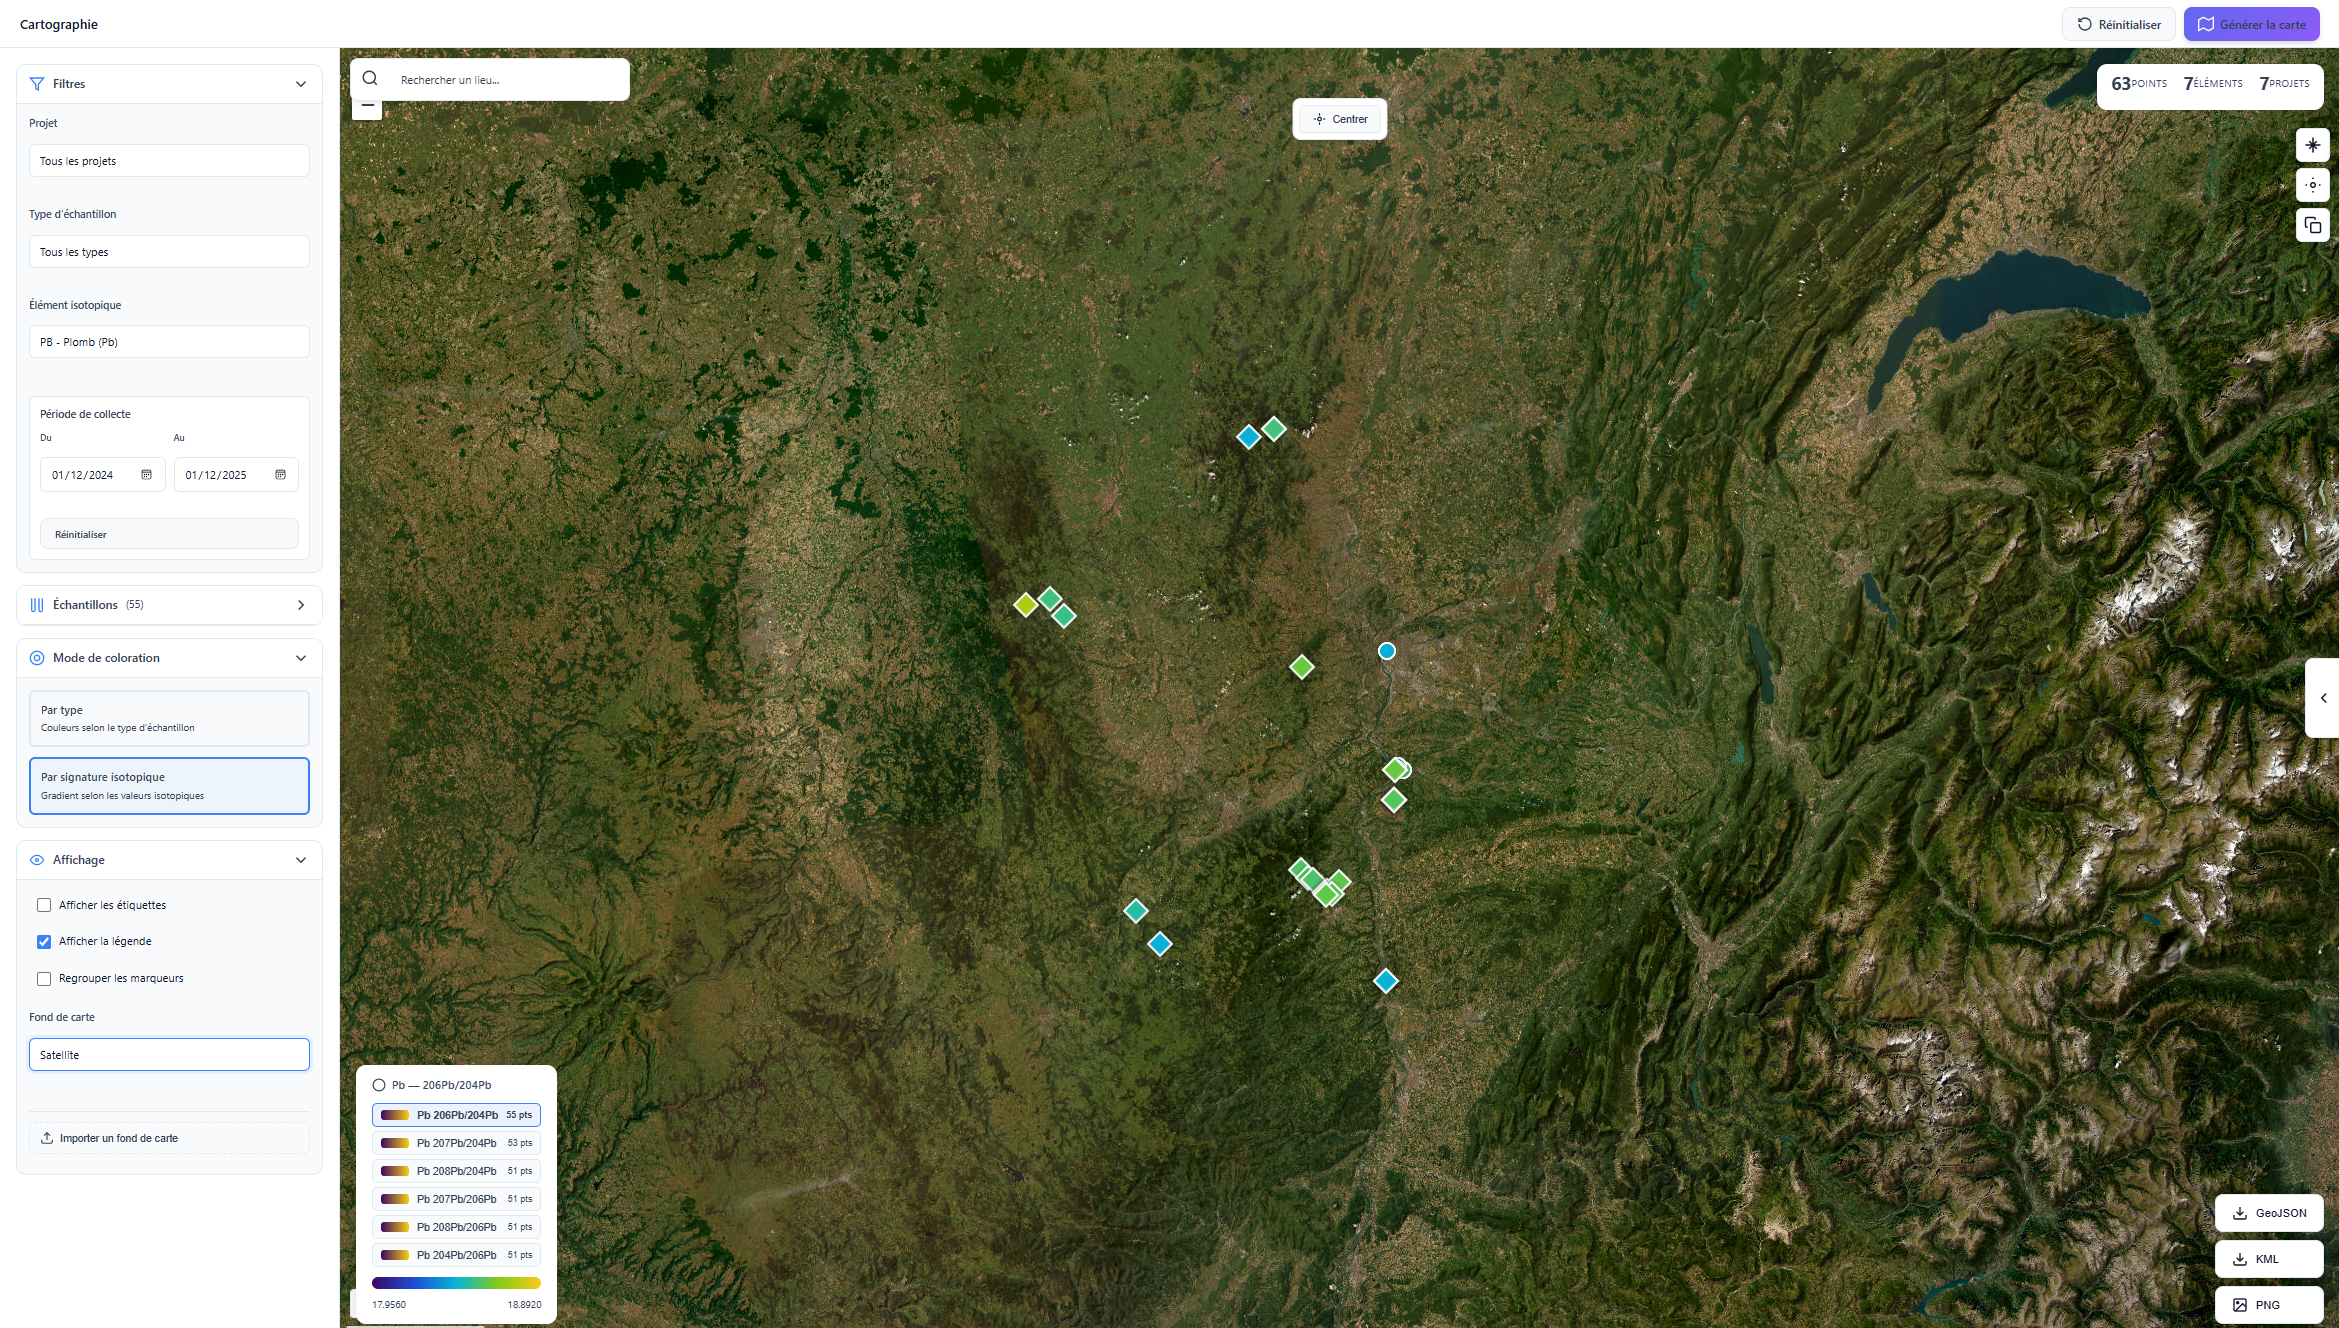 Figure 1: Main interface of the integrated mapping module.
The interface has been designed for performance and simplicity, built around four control pillars:
- Multi-criteria filters: Display your data by project, sample type, chemical element or collection date.
- Granular selection: Individually choose the points to isolate on the map from the dedicated tab.
- Colour modes:
- By type: Visually distinguish sources from "daughter" samples.
- By ratio: Apply a colour gradient based on measured isotopic values.
- Basemap management: Native support for Satellite, OSM, Terrain and custom layer import.
Features and Analysis Tools
Adaptive scales
The software dynamically recalculates legends according to the selected ratio. Click on a ratio to have the map colour scheme automatically adjust to the bounds of your dataset.
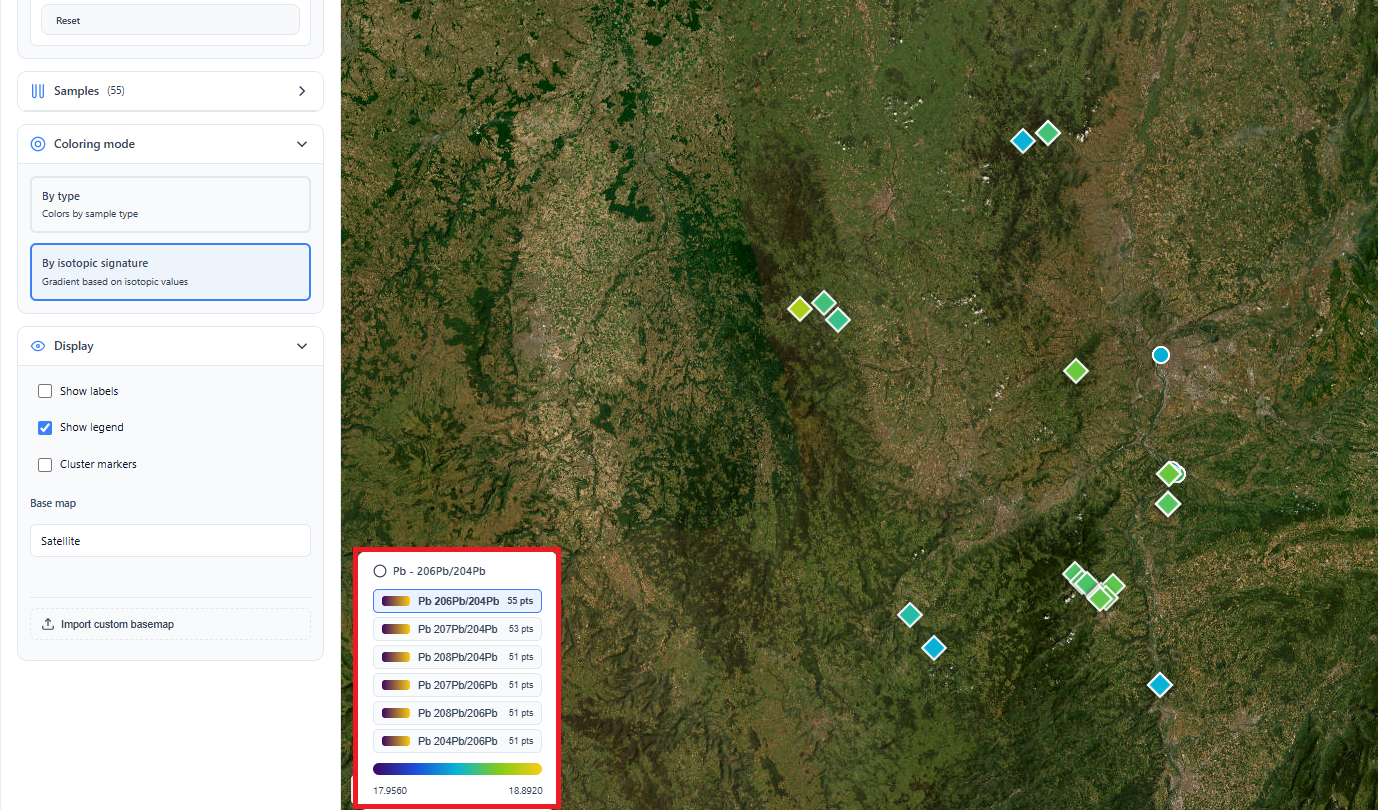 Figure 2: Dynamic legend update according to the isotopic ratio.
Interoperability and Exports
For your reports or use in third-party software (QGIS, Google Earth), IsoFind prepares export to standard market formats (currently being implemented).
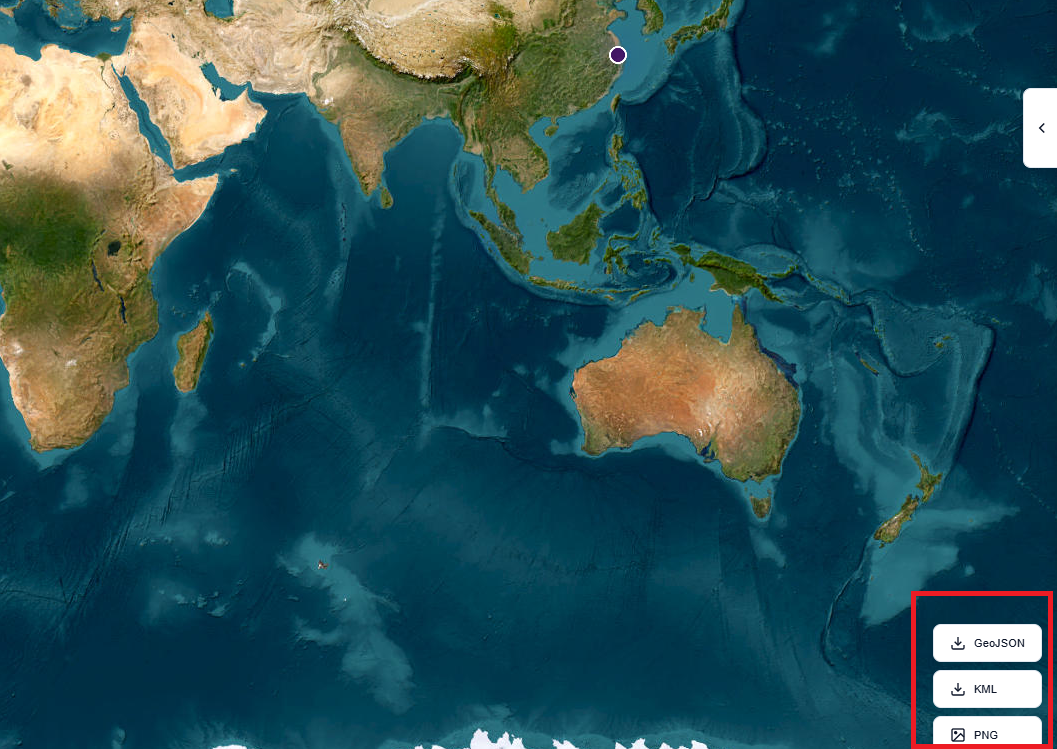 Figure 3: Export module (GeoJSON, KML, PNG).
Measurement and navigation tools
A floating toolbar (Figure 4) enables quick interactions with the spatial view:
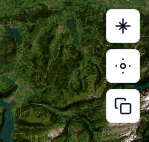
- Distance measurement: Calculate the geodesic distance between two sampling points.
- Geolocation: Re-centre the view on your current position.
- Clipboard: Copy the coordinates of the current view for quick sharing.
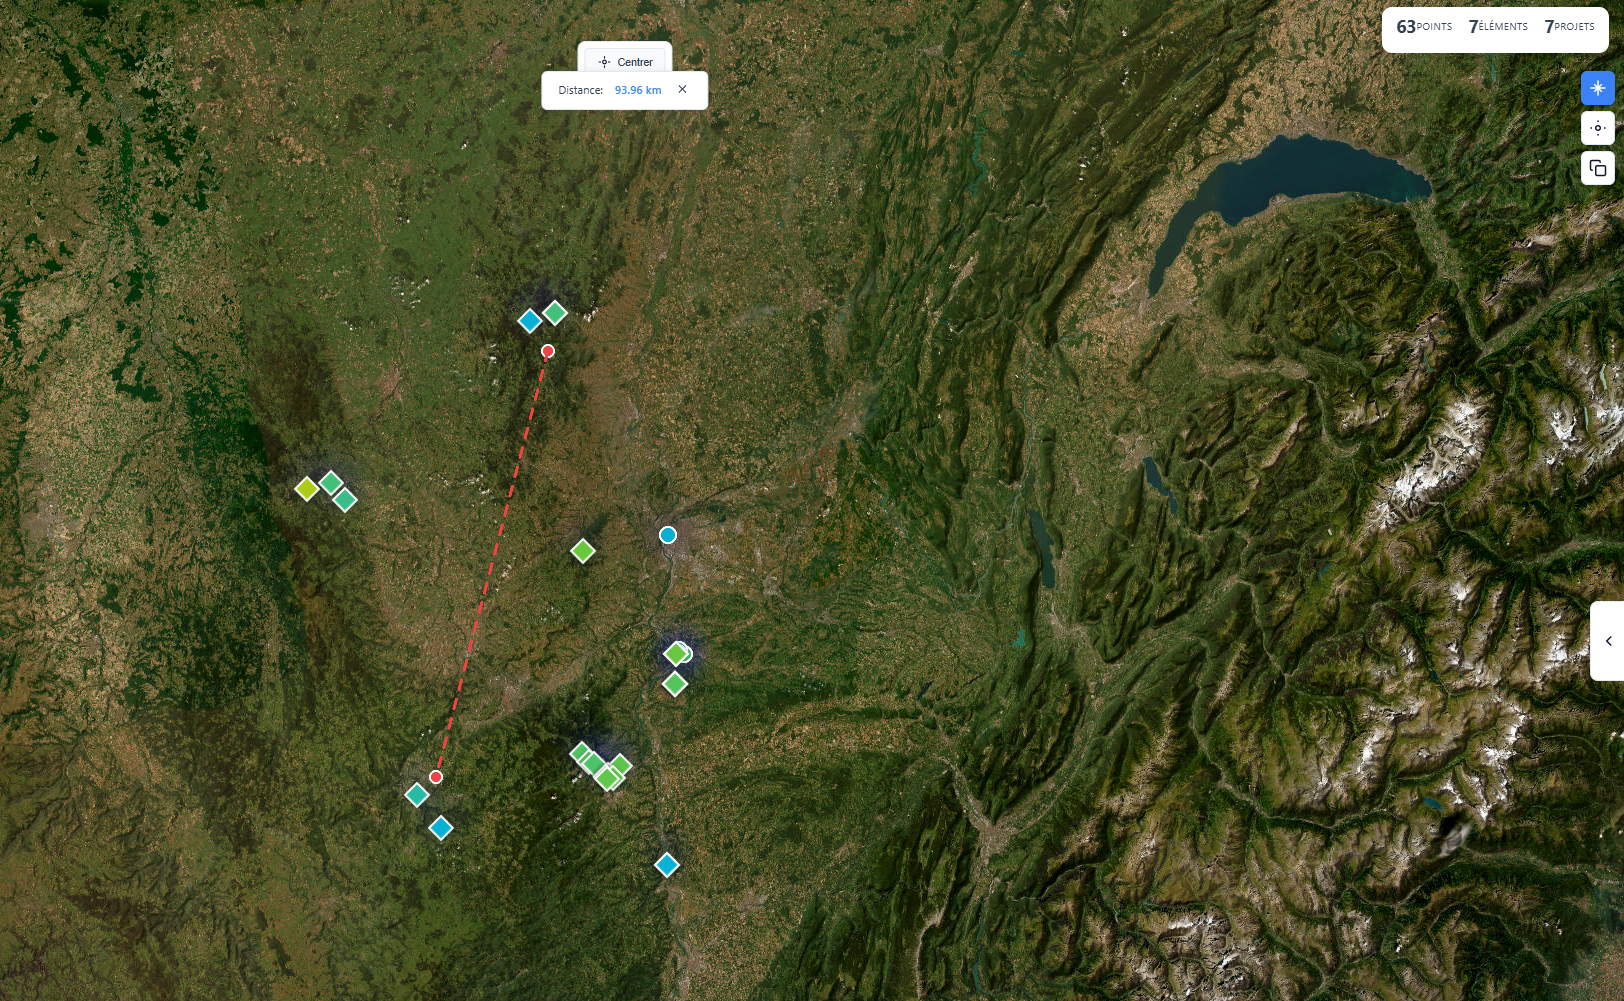 Figure 5: Distance measurement tool between two points of interest.
Advanced Visualisations
By expanding the right side panel, you gain access to visual synthesis tools for handling high point densities:
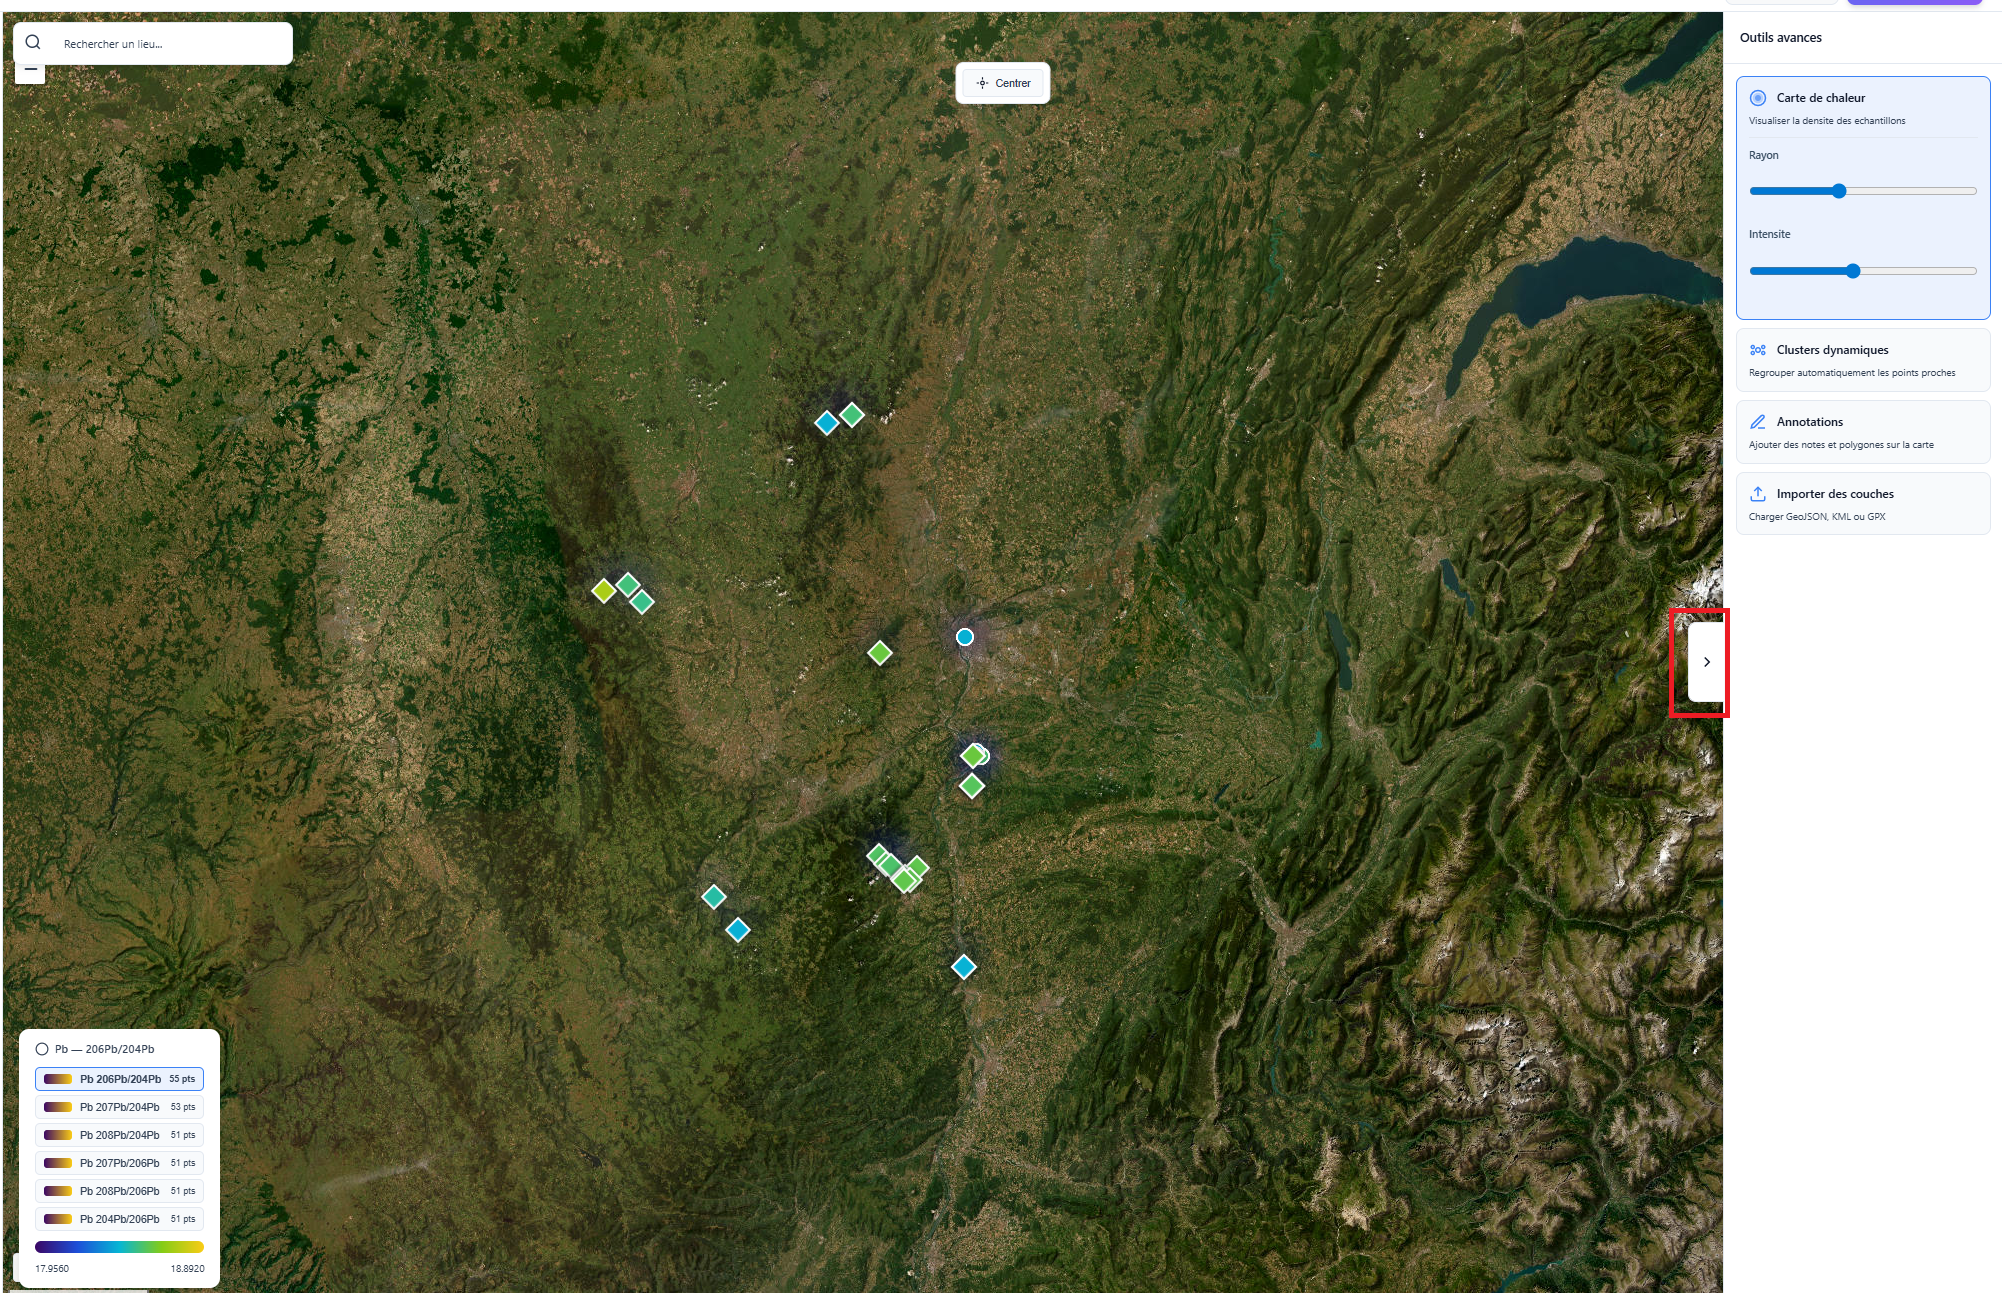 Figure 6: Heatmap, dynamic cluster and annotation system modes.
Density analysis: Dynamic clusters automatically group nearby samples when zooming out to maintain readability, while Heatmaps reveal concentration zones of specific signatures.