Wednesday, 1 April, 2026
Isotopic Tools
IsoFind integrates a suite of isotopic calculation tools accessible from the Tools menu. These calculators operate entirely locally, with no connection required. They cover four domains: mass and spectrometry calculations, conversion between isotopic notations, database data validation, and an interactive Python console for ad hoc analysis.
Tools Menu
→
Isotopic Calculator
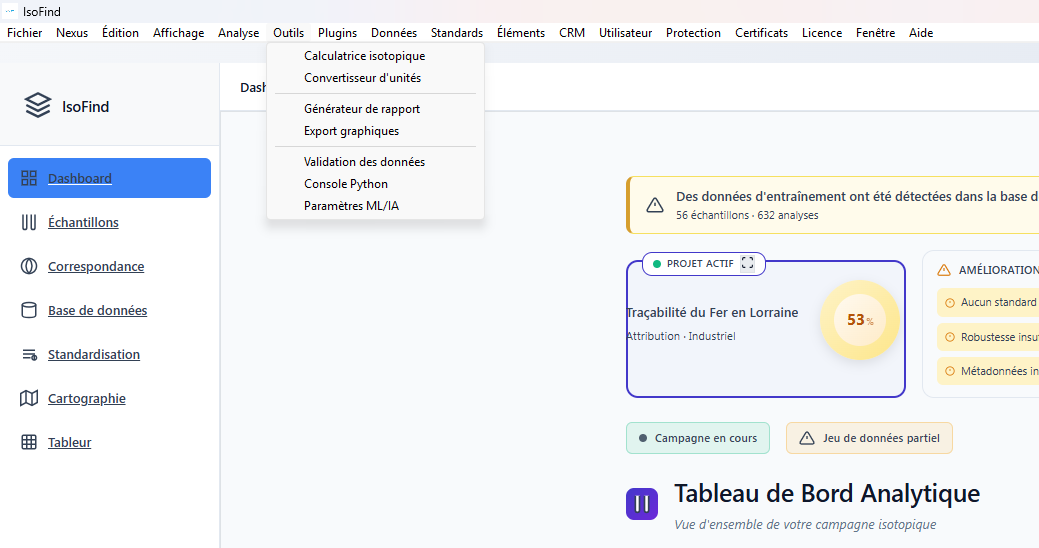 Figure 1: Isotopic tools panel with the four main tabs.
Tool 1: Mass and Spectrometry Calculator
The first tool groups three calculation functions related to molecular mass and isotopic mass spectrometry.
m/z Search
This tool identifies molecular formulas corresponding to a given mass-to-charge ratio (m/z) within a tolerance window expressed in ppm. It is useful for interpreting a mass spectrum peak whose assignment is uncertain.
The algorithm uses a two-pass process. It begins with a search in a catalog of known molecules, then performs a combinatorial decomposition of possible masses across chemically plausible elements within the range [m/z - delta, m/z + delta]. Results are ranked by chemical plausibility score, then by residual error in ppm. The table returns the top 50 candidates with their brute formula, isotopic peak assignment (monoisotopic M, or M+1, M+2...), calculated exact mass, error in ppm, and molecule type.
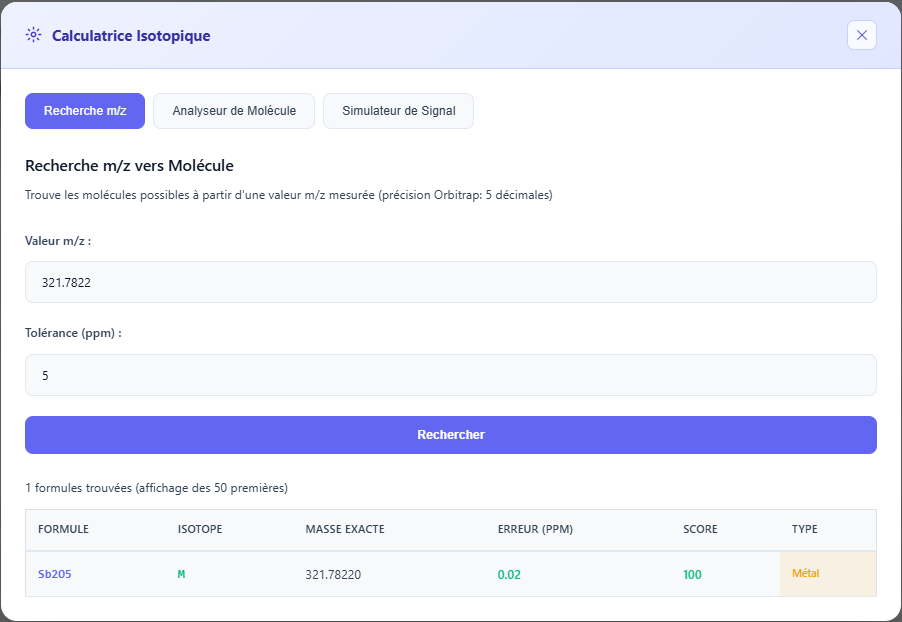 Figure 2: m/z search results with ranking by plausibility score.
For trace elements in geochemistry (Sb, Pb, Sn...), a tolerance of 5 ppm is a reasonable starting point with a high-resolution spectrometer. Below 2 ppm, the selected candidates are generally few and directly usable. Beyond 20 ppm, the list becomes too long for direct interpretation.
Molecular Mass Calculator
Calculates the exact monoisotopic mass, average mass, and full isotopic distribution (top 10 peaks) of a molecular formula. Three input notations are accepted:
| Notation | Example | Usage |
|---|---|---|
| Simple formula | Sb2O5 Ca(NO3)2 Fe2(SO4)3 | Calculates mass using natural abundances of all isotopes. |
| Specified isotopes | [121]Sb2[16]O5 | Calculates exact mass for a precise isotopic combination. Also returns the formatted isotopic formula. |
| Parentheses | Ca(NO3)2 Fe2(SO4)3 | Parentheses and their coefficients are automatically expanded before calculation. |
The isotopic distribution displays the m/z ratio, isotopic assignment, relative abundance, and a proportional visual bar. The monoisotopic peak is highlighted. This distribution corresponds to what a spectrometer would measure for this formula in its natural state.
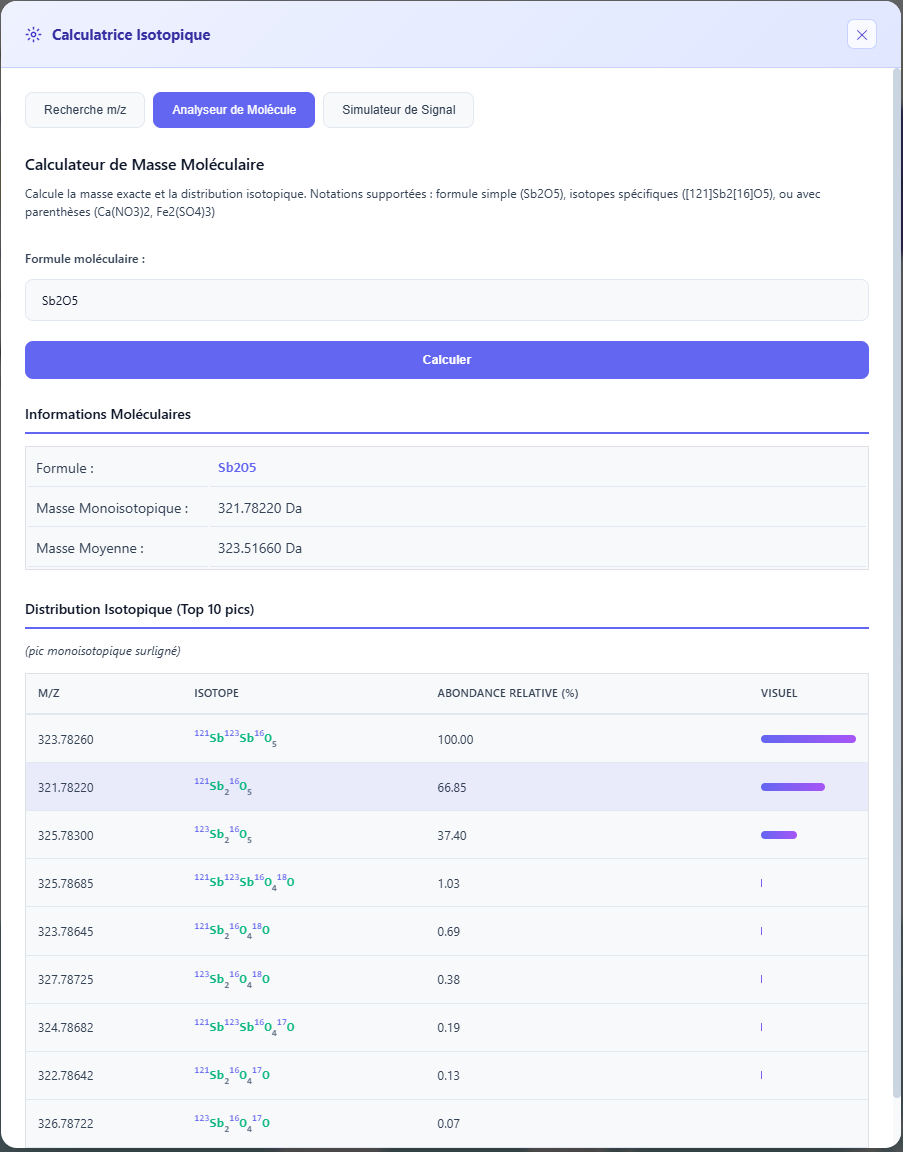 Figure 3: Calculated isotopic distribution for Sb2O5, with highlighted monoisotopic peak.
Signal Simulator
Predicts expected signal intensities for each isotopic peak of a molecule, based on a reference signal measured on the main peak. Useful for checking for isobaric interference or for anticipating the signal on M+1 and M+2 peaks before measurement.
The user enters the molecular formula and the signal value measured on the reference peak. The tool returns the natural abundance, expected signal in absolute units, and relative intensity as a percentage of the maximum for each peak.
Tool 2: Isotopic Converter
The converter unifies conversions between all common isotopic notations in a single interface, with management of reference standards and concentration units.
Conversion between notations (delta, ratio, epsilon, mu, alpha)
The Isotopic Notations tab simultaneously converts a value entered in any notation to all others. Simply choose the source notation, enter the value, specify the reference standard ratio R_std, and click Convert all notations.
| Notation | Symbol | Formula from R | Unit |
|---|---|---|---|
| Absolute Ratio | R | R = R_std × (delta/1000 + 1) | unitless |
| Delta | delta | delta = (R / R_std - 1) × 1000 | ‰ |
| Epsilon | epsilon | epsilon = (R / R_std - 1) × 10,000 | 10^-4 |
| Mu | mu | mu = (R / R_std - 1) × 1,000,000 | ppm |
| Alpha | alpha | alpha = R / R_std | unitless |
| 1000 ln(alpha) | 1000 ln(alpha) | 1000 × ln(alpha) | ‰ |
Each calculated value has an individual copy button for direct insertion into another tool or spreadsheet.
 Figure 4: Simultaneous conversion to all notations, with per-line copy buttons.
Delta to Ratio and Ratio to Delta
The Delta/Ratio tab offers two quick calculators for the most frequent individual conversions, with selection of the reference standard from the built-in library or the IsoFind database.
Each result displays the formula used, the name of the selected standard, its R_std, and immediate equivalences (epsilon, mu for delta to ratio; epsilon, mu, alpha for ratio to delta).
Integrated Reference Standards
The following standards are available natively. The "Load from DB" button also retrieves custom standards saved in IsoFind.
| Element | Standard | Ratio | Notation |
|---|---|---|---|
| Sr | NIST SRM 987 | 0.710248 | 87Sr/86Sr |
| Sr | Modern Seawater | 0.70918 | 87Sr/86Sr |
| Nd | JNdi-1 | 0.512115 | 143Nd/144Nd |
| Nd | La Jolla | 0.511858 | 143Nd/144Nd |
| Nd | CHUR | 0.512638 | 143Nd/144Nd |
| Pb | NIST SRM 981 | 16.9405 | 206Pb/204Pb |
| Pb | NIST SRM 982 | 36.7219 | 206Pb/204Pb |
| O | VSMOW | 0.0020052 | 18O/16O |
| O | VPDB | 0.0020672 | 18O/16O |
| C | VPDB | 0.0111802 | 13C/12C |
| S | VCDT | 0.0450045 | 34S/32S |
| N | AIR | 0.0036765 | 15N/14N |
| H | VSMOW | 0.00015576 | D/H |
Concentration Conversion
The Concentrations tab converts between all common concentration units in geochemistry. Conversions involving molar units require the molar mass of the species. Conversions between mass and volume units require the solution density (1.0 g/mL by default).
| Group | Available Units |
|---|---|
| Mass-based | ppm (mg/kg), ppb (µg/kg), ppt (ng/kg), % (g/100g) |
| Volume-based | mg/L, µg/L, ng/L |
| Molar | mol/L (M), mmol/L (mM), µmol/L (µM) |
The conversion path is displayed with the intermediate formula, allowing for verification of calculation consistency. Examples: C(ppm) = C(mol/L) × M × 1000 / density for mol/L to ppm, and C(mol/L) = C(ppm) × density / (M × 1000) for the inverse.
Tool 3: Data Validation
The validator automatically scans all samples in the active database and flags quality issues based on a set of configurable rules.
Available Validation Rules
Each rule can be individually enabled or disabled before launching validation. All are enabled by default.
| Rule | What it checks | Level |
|---|---|---|
| Range Check | Compares isotopic values against validity ranges and typical ranges for each known ratio. Generates an error if the value is outside the physically admissible range, a warning if it is atypical but within limits. | Error / Warning |
| Outlier Detection | Identifies values statistically distant from the database distribution (z-score criterion). | Warning |
| Completeness | Verifies that each sample has at least a name and at least one associated isotopic data point. | Error / Warning |
| Duplicates | Detects identical sample names in the database. | Warning |
| GPS Coordinates | Verifies that latitude is within [-90, 90] and longitude within [-180, 180]. | Error |
Reference Ranges Used
Validity ranges and typical ranges are defined for the most common isotopic ratios:
| Ratio | Admissible Range | Typical Range |
|---|---|---|
| 87Sr/86Sr | 0.700 to 0.750 | 0.703 to 0.730 |
| 143Nd/144Nd | 0.5100 to 0.5140 | 0.5118 to 0.5130 |
| 206Pb/204Pb | 14.0 to 25.0 | 16.0 to 20.0 |
| 207Pb/204Pb | 14.5 to 16.5 | 15.0 to 16.0 |
| 208Pb/204Pb | 35.0 to 45.0 | 36.0 to 42.0 |
| delta18O | -50 to +50 ‰ | -20 to +20 ‰ |
| delta13C | -50 to +10 ‰ | -30 to 0 ‰ |
| delta34S | -50 to +50 ‰ | -20 to +30 ‰ |
| delta15N | -20 to +30 ‰ | -5 to +20 ‰ |
| deltaD | -400 to +100 ‰ | -200 to 0 ‰ |
Results and Report
Once validation is complete, the Validate tab displays a numeric summary: number of valid samples, number of warnings, and number of errors. The Report tab lists each issue with the sample name, the affected field, the error message, and the severity level. The report can be exported as a CSV.
 Figure 5: Validation report with errors and warnings listed by sample.
Running validation after every major import is good practice. Range errors detected immediately after import often point to a column error in the source CSV (for example, a ratio expressed in delta notation imported as an absolute ratio).