Wednesday, 1 July, 2026
Standardising Data
In isotopic geochemistry, measured ratios are values relative to an internal standard. To enable inter-laboratory comparisons, IsoFind integrates an automatic standardisation engine that applies shift corrections in the background on each import.
Do not confuse standardisation (management of reference frameworks and offsets between internal and international standards) with data normalisation (harmonisation of material types and entries).
Registering a Standard
Standards
→
Isotopic standards
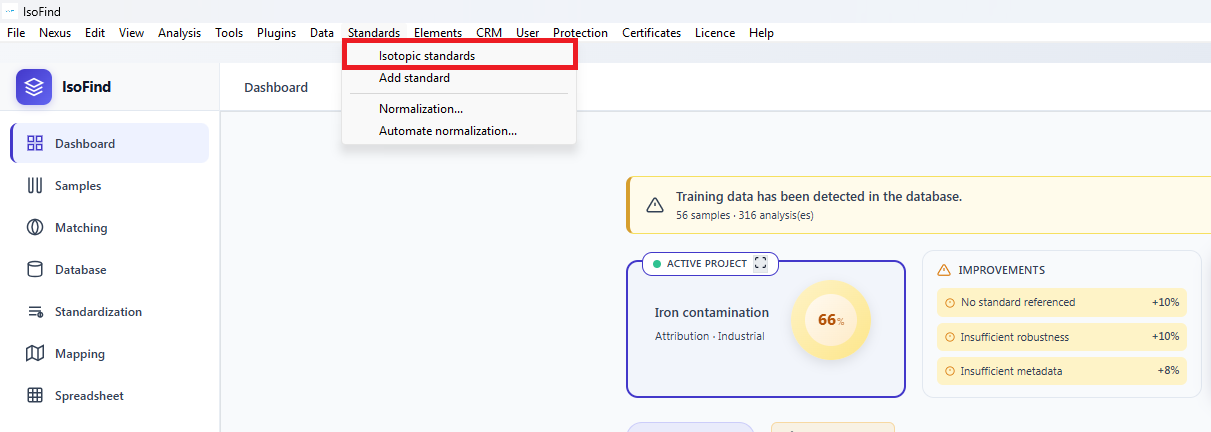 Figure 1: Accessing the reference framework manager.
The interface is divided into two parts: the list of existing standards on the left, and the creation form on the right.
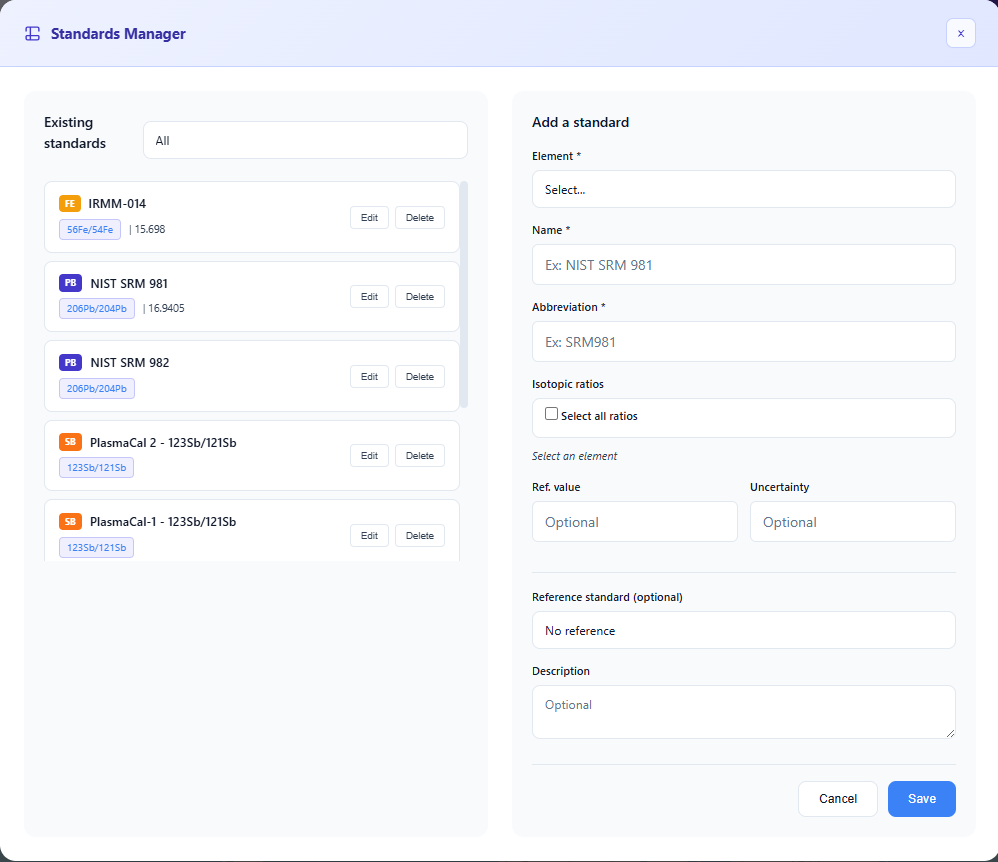 Figure 2: Standard creation and editing interface.
The chosen abbreviation will be the standard's reference name throughout the software. To enable automatic standardisation, fill in the Reference standard field and the isotopic shift value: the known offset between the two standards.
Automating Standardisations
Once the standards are created, access the Standardisation tab to enable guidance. The software automatically detects non-standardised samples and guides you through a three-step workflow.
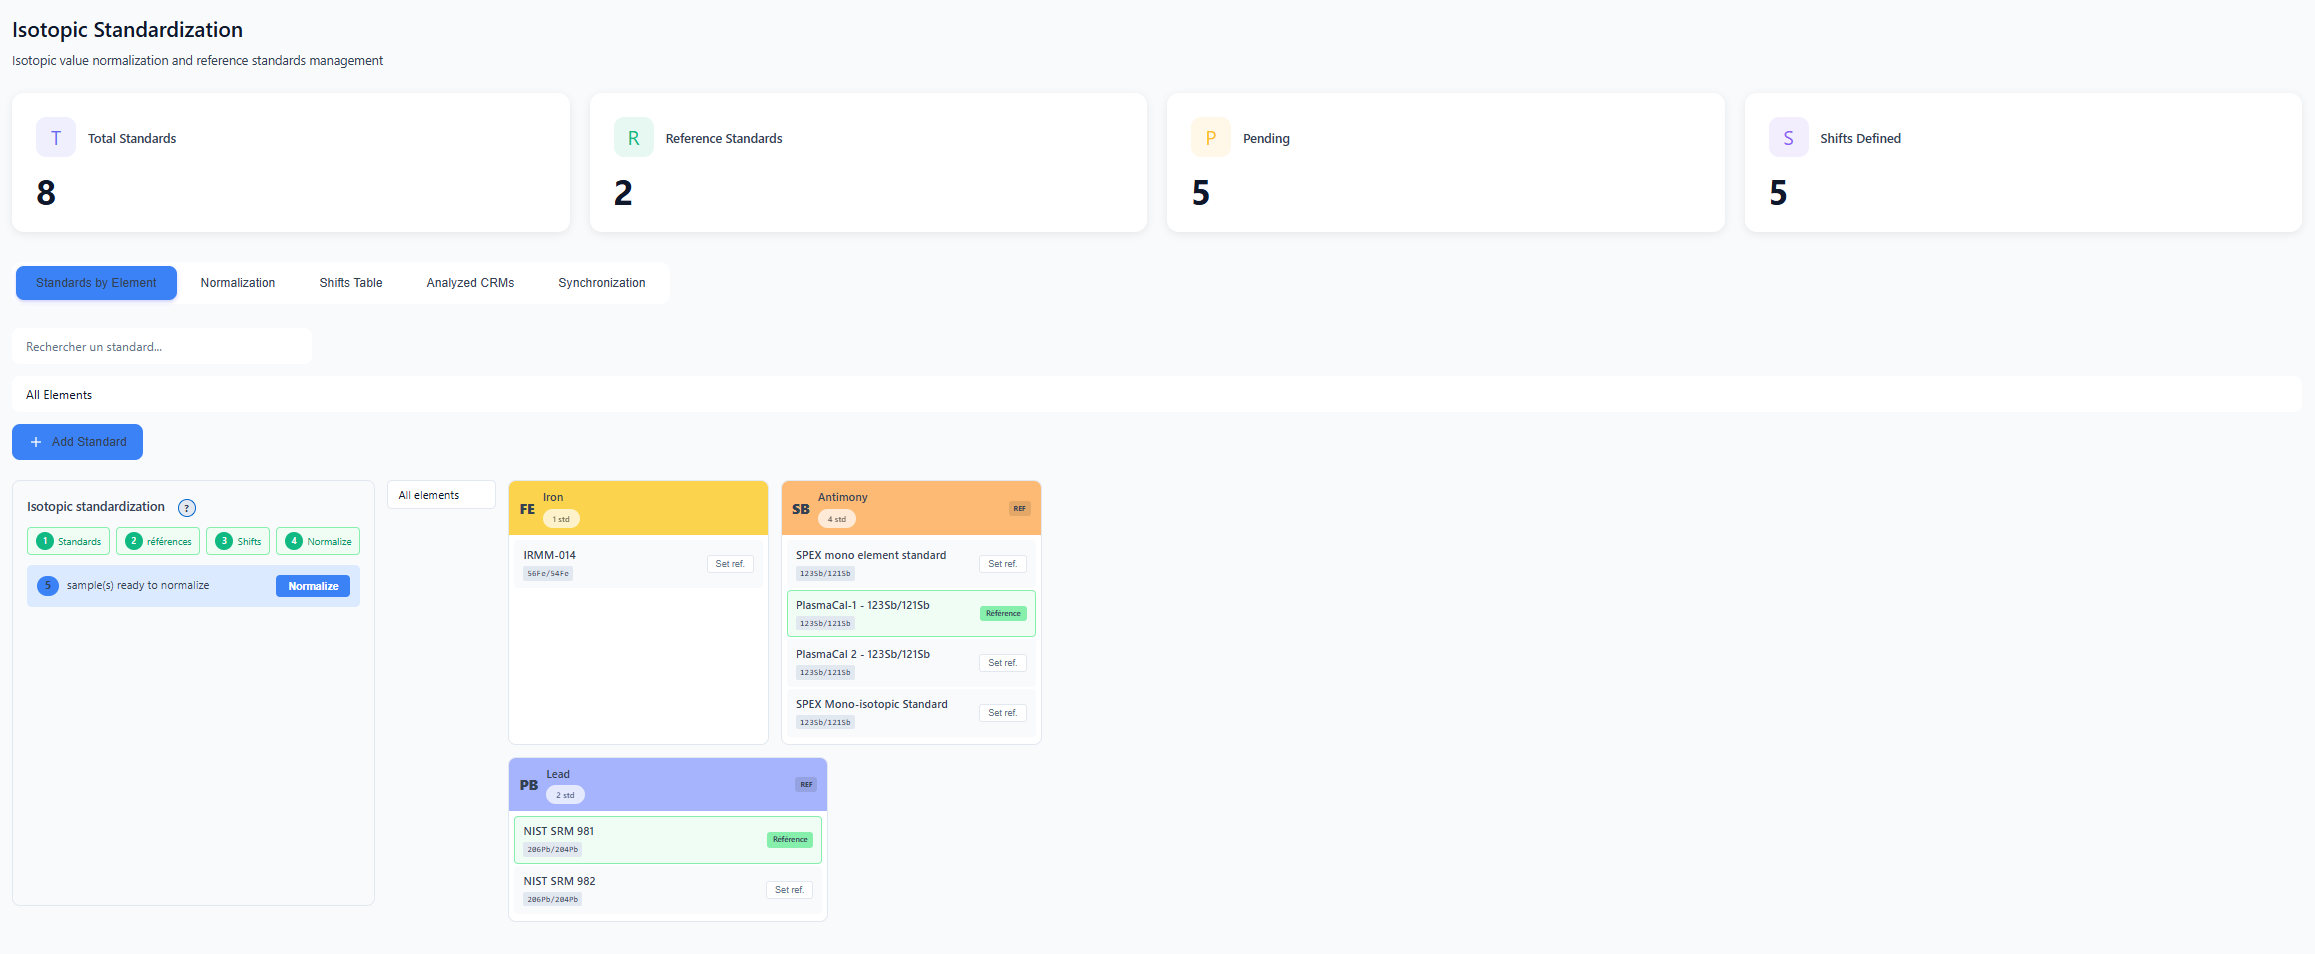 Figure 3: Standardisation dashboard.
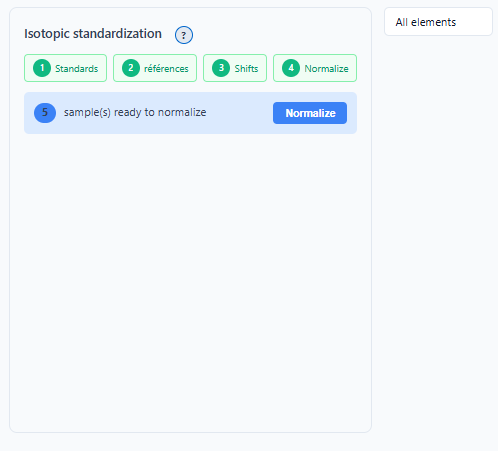 Figure 4: Intelligent configuration assistant.
Defining references per element
For each element (Pb, Sr, O...), designate which standard takes precedence by clicking Set ref. Once confirmed, the button turns green.
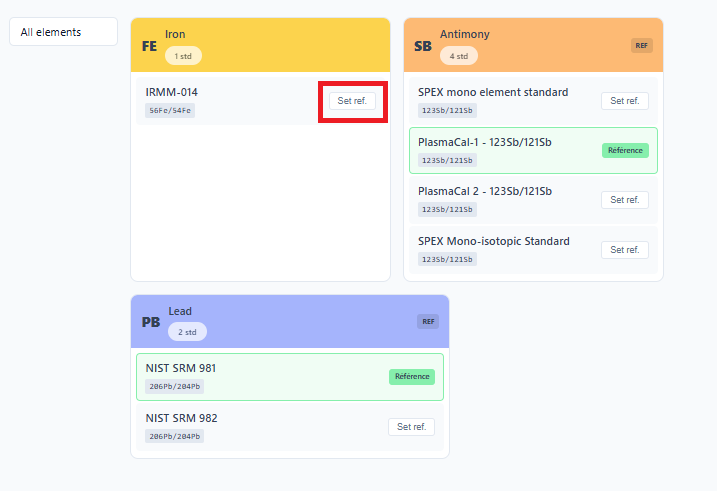 Figure 5: Reference validation status per isotopic system.
Once these steps are completed, IsoFind applies shift corrections in the background on every new import. No further manual intervention is required.
For direct access to the settings without going through the dedicated tab:
Standards
→
Automate standardisations
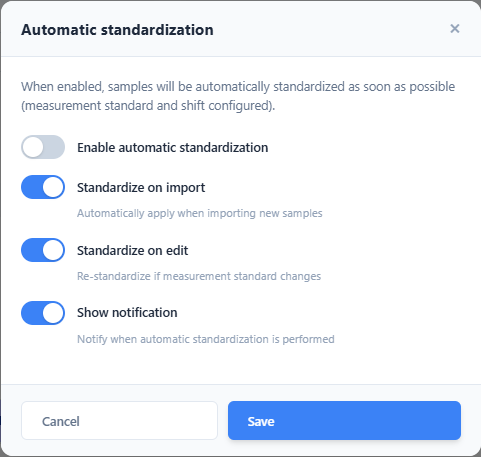 Figure 6: Quick access to standardisation configuration.
Tracking and Traceability
The tracking screen provides complete traceability: which samples were converted, to which reference framework, and what shift factor was applied.
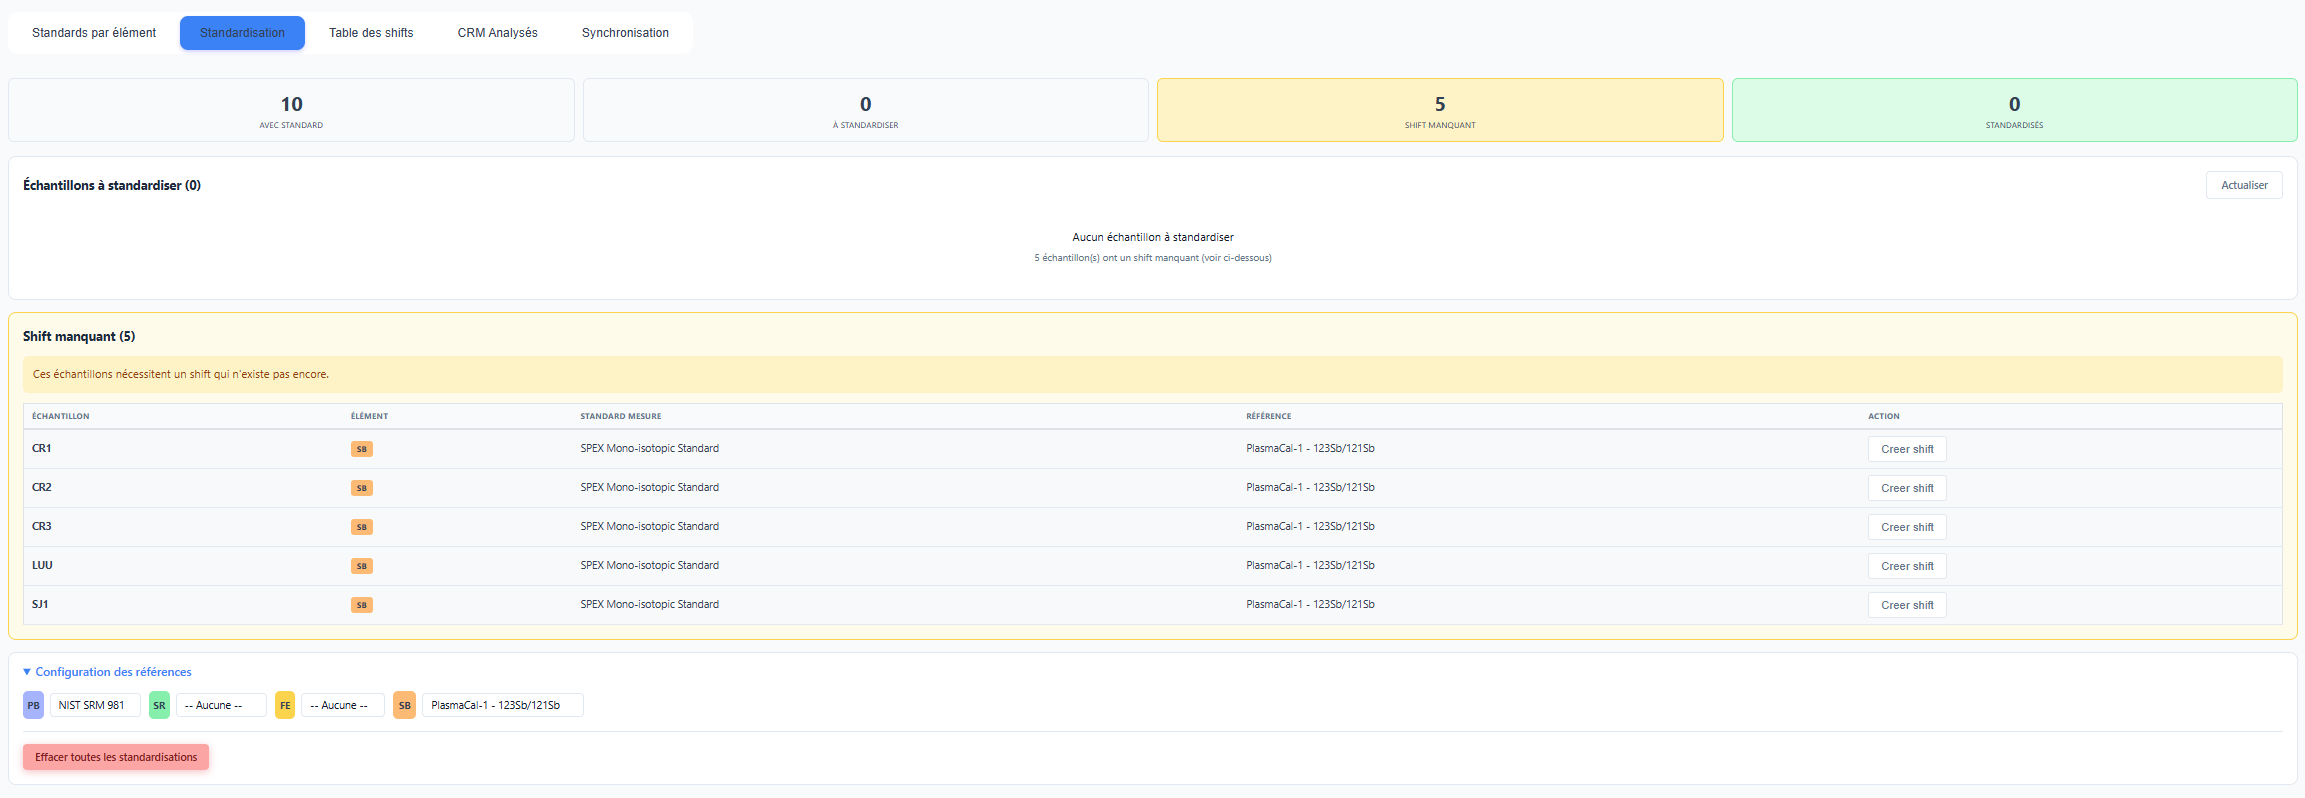 Figure 7: Log of completed and pending standardisations.
Samples requiring action are flagged visually. In the Database tab, a red indicator shows the exact number of pending ratios for each row, preventing a non-standardised value from being used in error in an analysis.
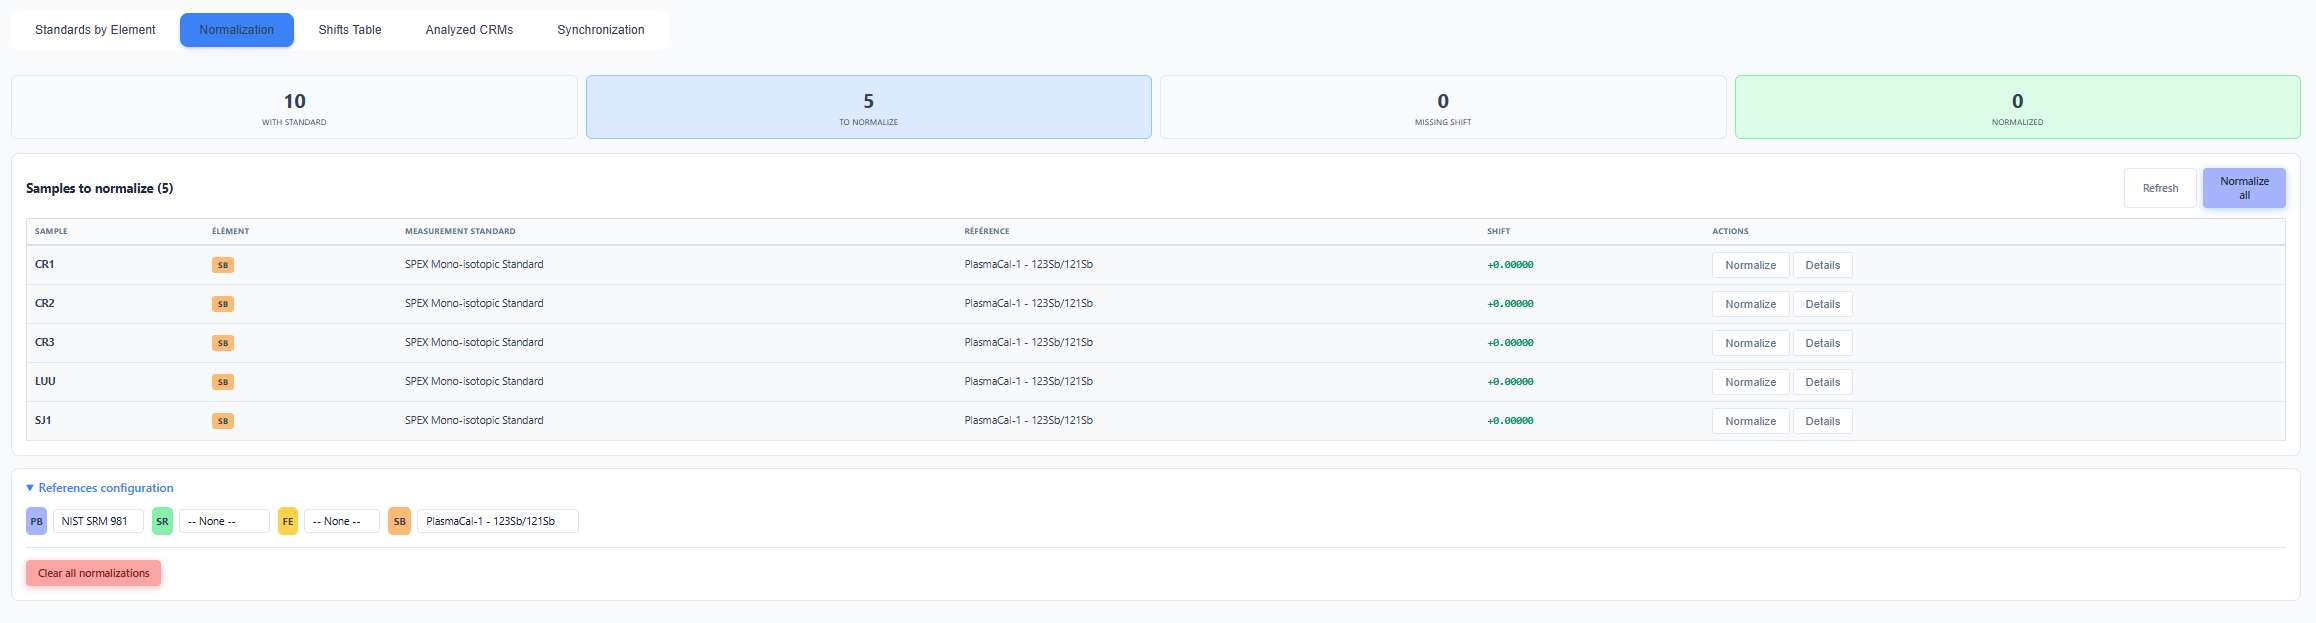 Figure 8: Visual alert system in the database.
Isotopic Shift Mapping
The Shift table tab visualises the relationships between standards graphically. This tool allows new shifts to be added manually and provides an at-a-glance understanding of how laboratory data relates to international scales.
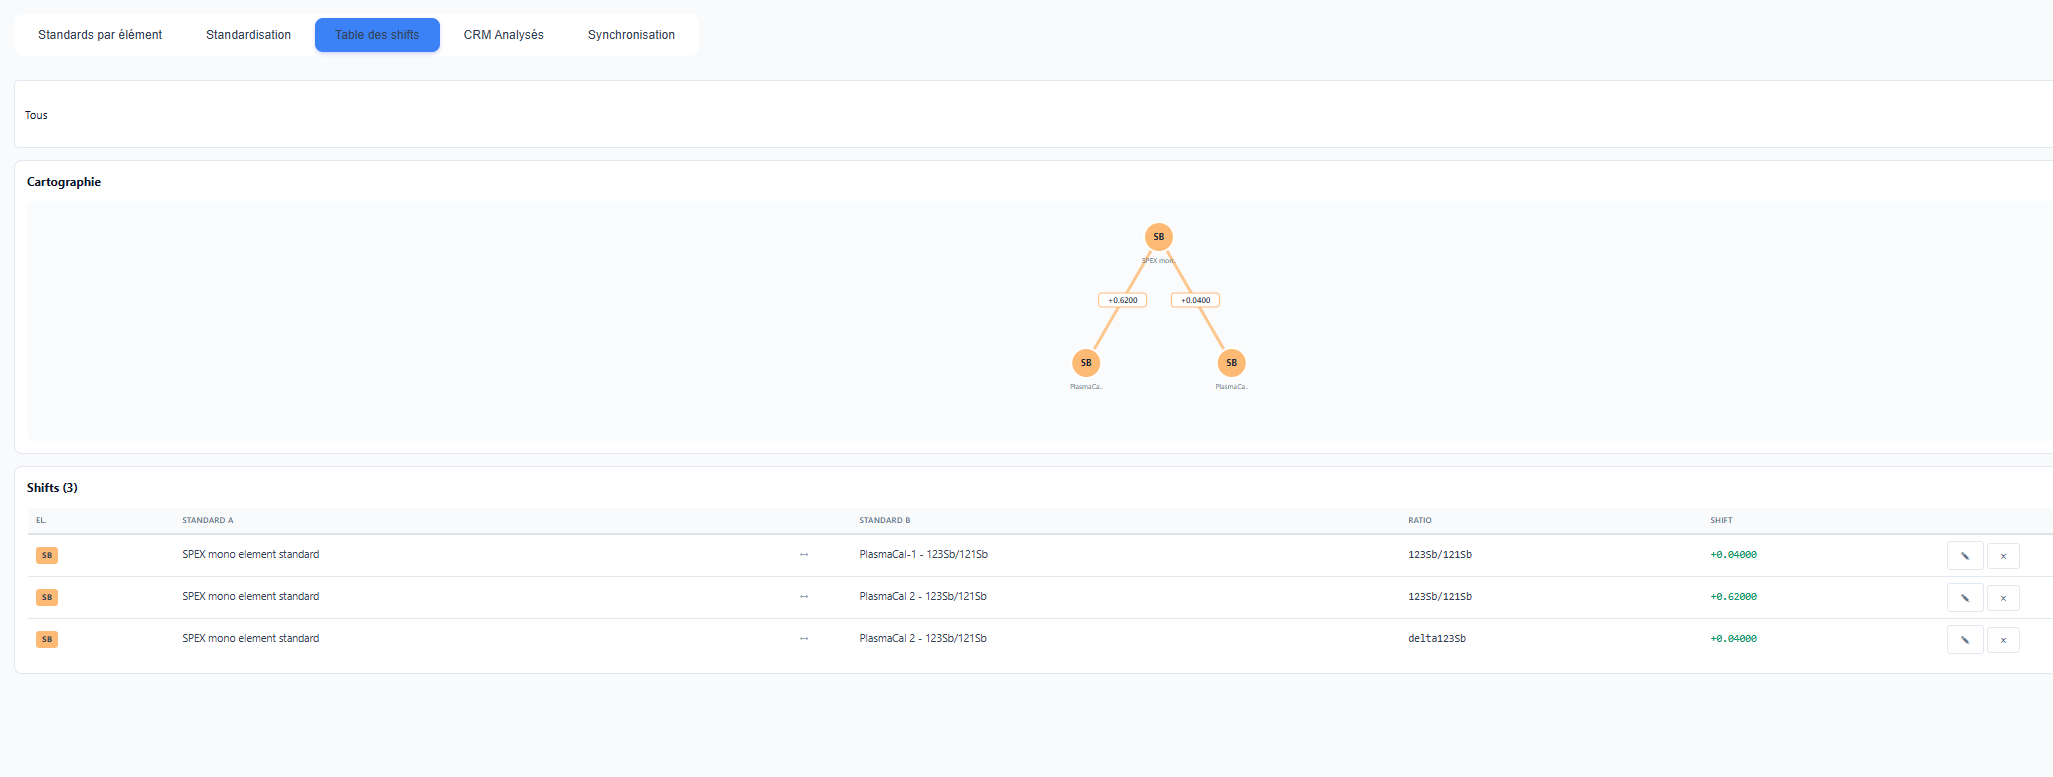 Figure 9: Relational graph of internal and international standards.
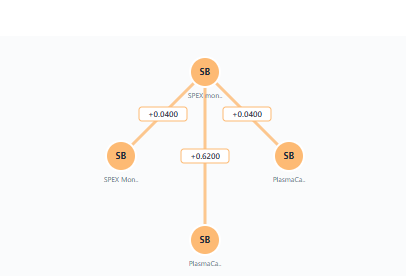 Figure 10: Close-up of shift vectors and parentage relationships between standards.
This mapping is essential for isotopic data exchanges between laboratories. It explicitly documents the conversion chain applied to the data, which the .isof format embeds automatically at export.