
Whether you need to trace the origin of a metallic or organic contamination, model the dispersion of a contaminant in 3D, verify the provenance of a mineral, detect a food fraud or interpret archaeological data, IsoFind turns your isotopic measurements into clear, documented answers, accessible even without deep isotopic expertise.
When a river is contaminated or a soil shows abnormal levels of metals, PFAS or pesticides, you need to answer one simple question: where does this pollutant come from, and how is it spreading? Stable isotopes are the only tracers capable of answering that question without altering the environment. IsoFind organises the entire workflow, from raw data import to mapped results and a defensible report.
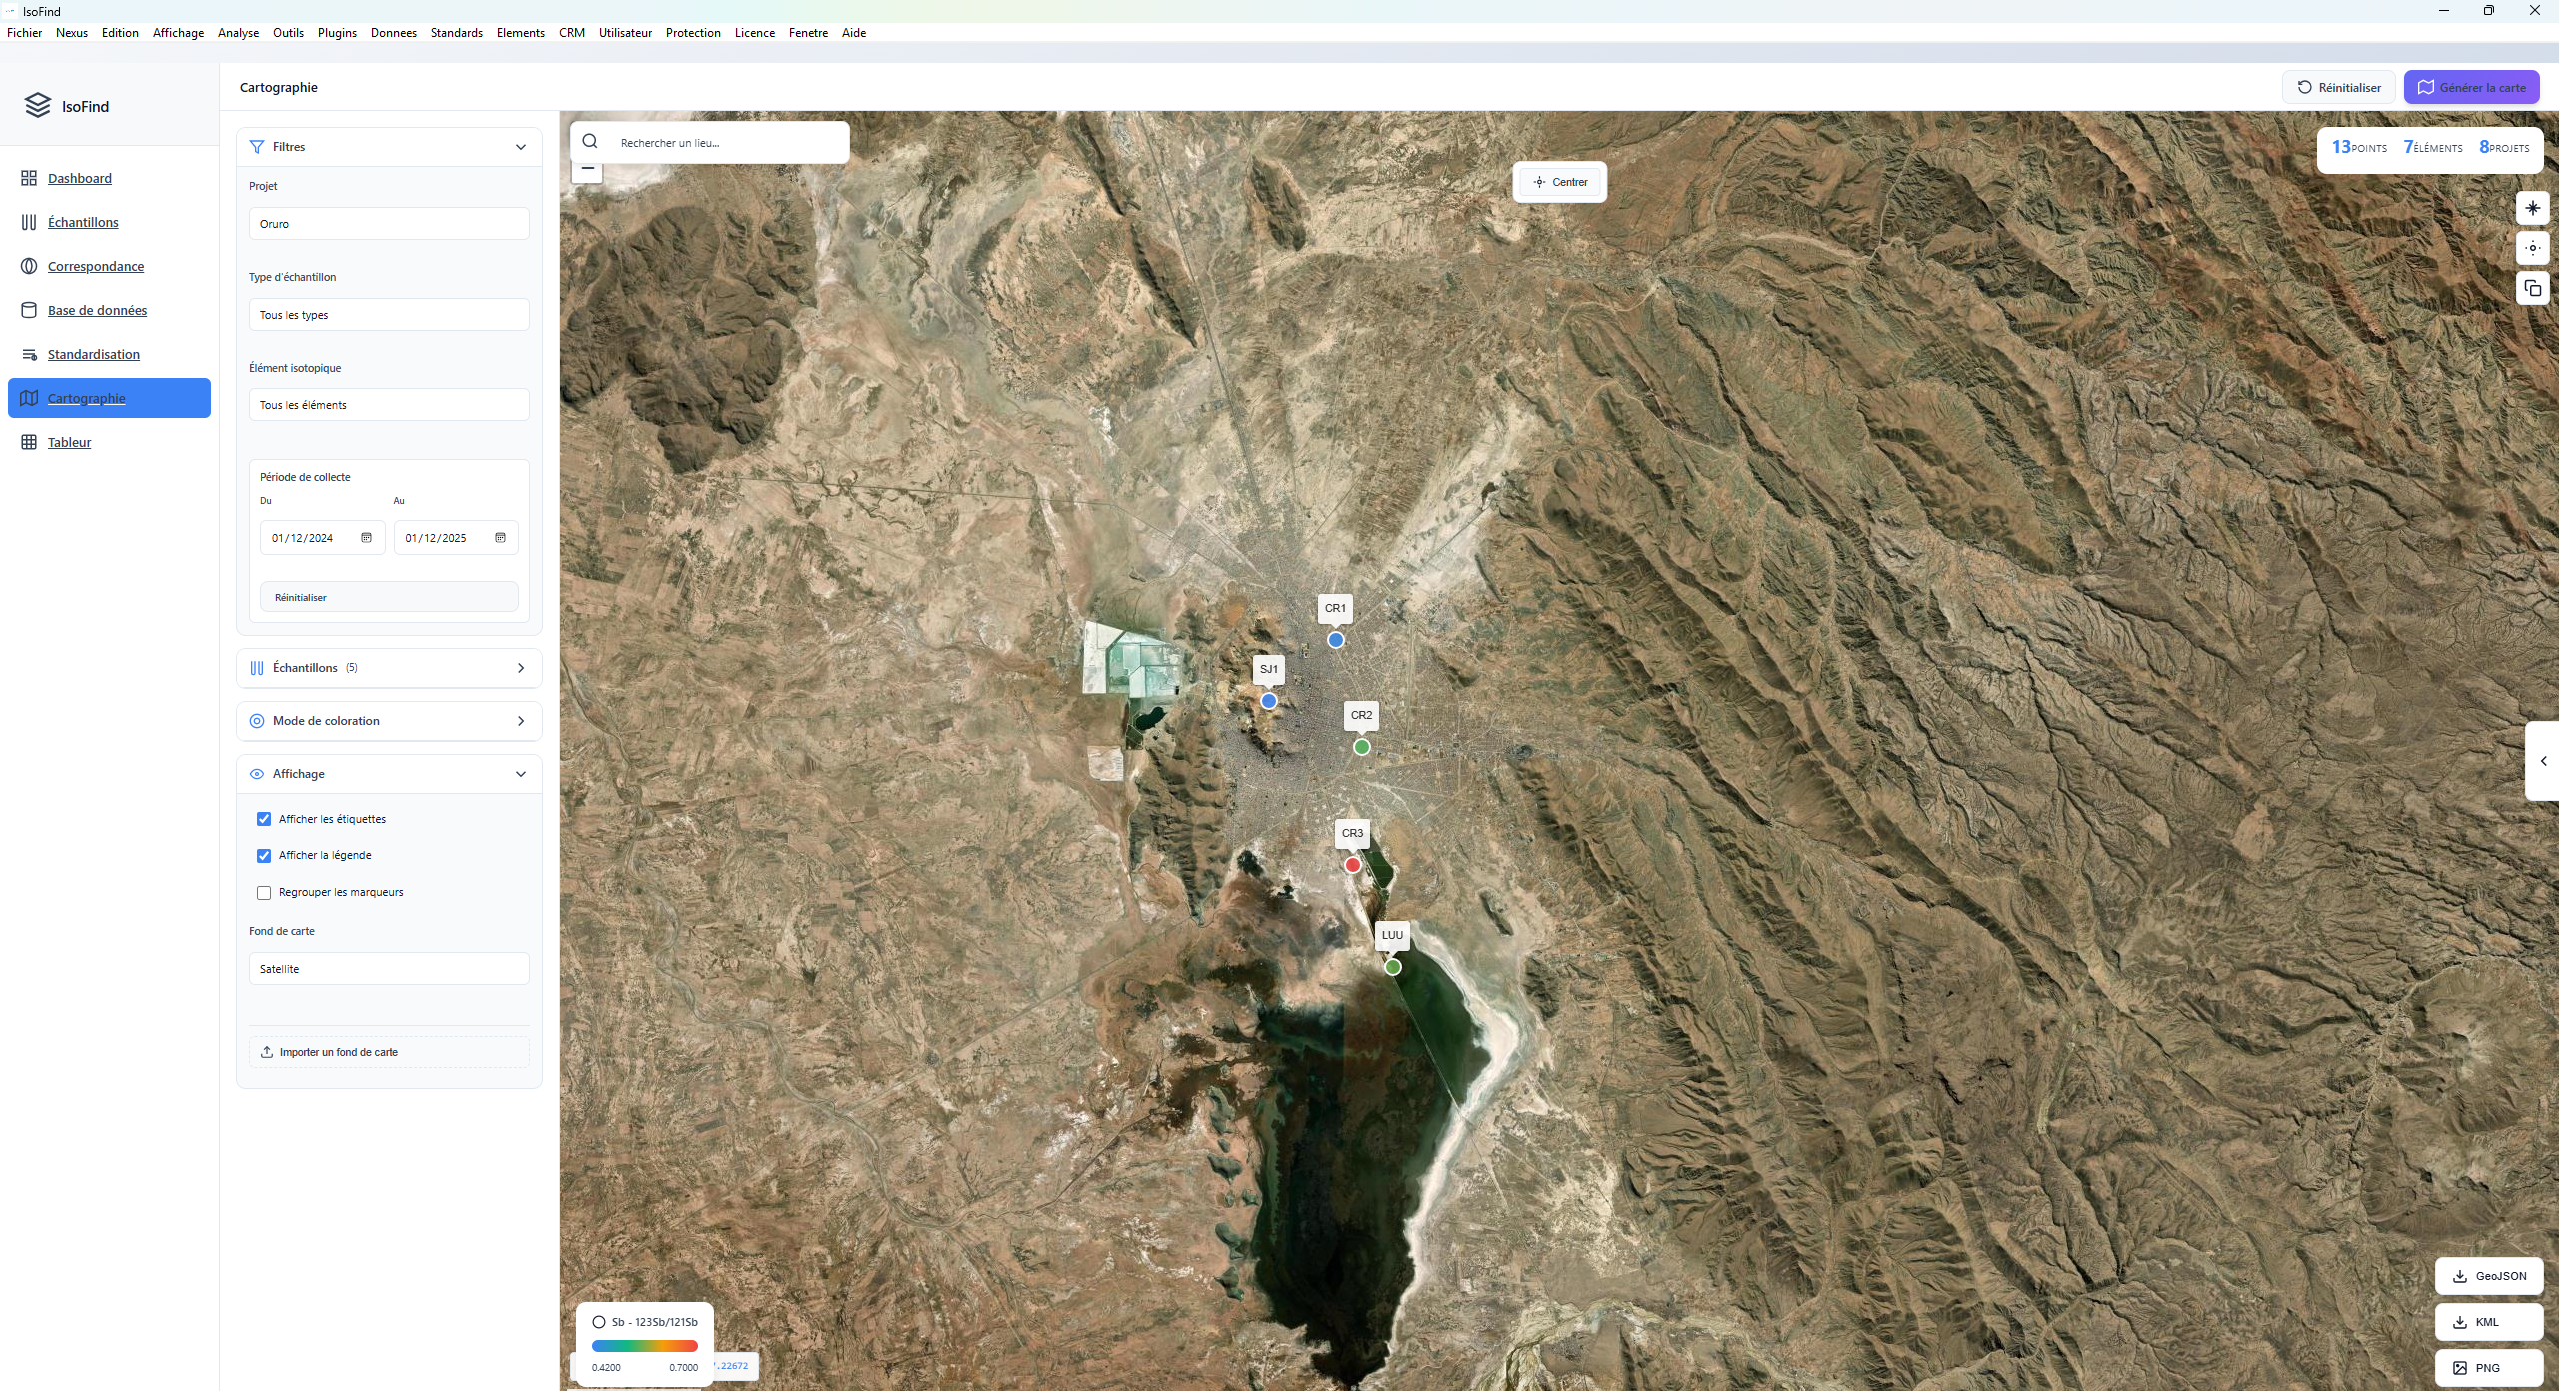
By comparing the isotopic signature of a contaminant to the fingerprints of known sources (industry, road traffic, mining activity...), IsoFind identifies the probable origin and calculates each source's contribution. Even when multiple sources mix simultaneously, isotopic unmixing quantifies each one separately.
Compare signatures measured at different dates to document the effectiveness of a remediation or detect the arrival of a new source. IsoFind manages time series and visualises trends.
Project your results onto an interactive map to delineate influence zones and contamination gradients. Direct export for reports to local authorities, water agencies or regulatory bodies.
Understand the mechanism by which a contaminant mobilises and spreads: oxidation, dissolution, adsorption onto iron minerals, gas-phase transfer. IsoFind models the isotopic fractionations associated with each process to distinguish sources from transport vectors.
Compound-specific isotope analysis (CSIA) of carbon (delta 13C) and chlorine (delta 37Cl) allows PFAS families to be distinguished by manufacturing process, quantifies in-situ pesticide biodegradation via the Rayleigh model, and identifies sources of pharmaceutical residues in surface water. IsoFind centralises and normalises this data molecule by molecule.
Reconstruct the contamination plume in three dimensions from your point data by IDW interpolation. The coupled predictive engine (geochemical prior + ML ONNX) simulates the temporal evolution of the contaminant in the aquifer, accounting for speciation, adsorption and degradation. Time slider, interactive cross-section, PNG export.
Combine Pb-Sb, Cu-Zn or S-O in a single discrimination space. IsoFind manages multi-dimensional display and confidence ellipses to separate sources that classical chemistry cannot distinguish.
Every processing step is automatically recorded. Generate a structured report including the cover page, geochemical conditions, ML speciation results, attribution scores and methodological limits, adapted to the requirements of environmental authorities and defensible in case of litigation.
Typical workflow in IsoFind
Ready to identify your contamination sources?
Download IsoFind for free. PFAS and pesticide tracing, including 3D visualisation, is available without a licence.Every raw material carries an isotopic fingerprint tied to its geology and extraction method. When a supplier changes source without declaring it, classical chemical methods miss it. Isotopic analysis detects it. IsoFind lets you build a signature reference by supplier, compare each incoming batch and produce a certifiable conformity report.
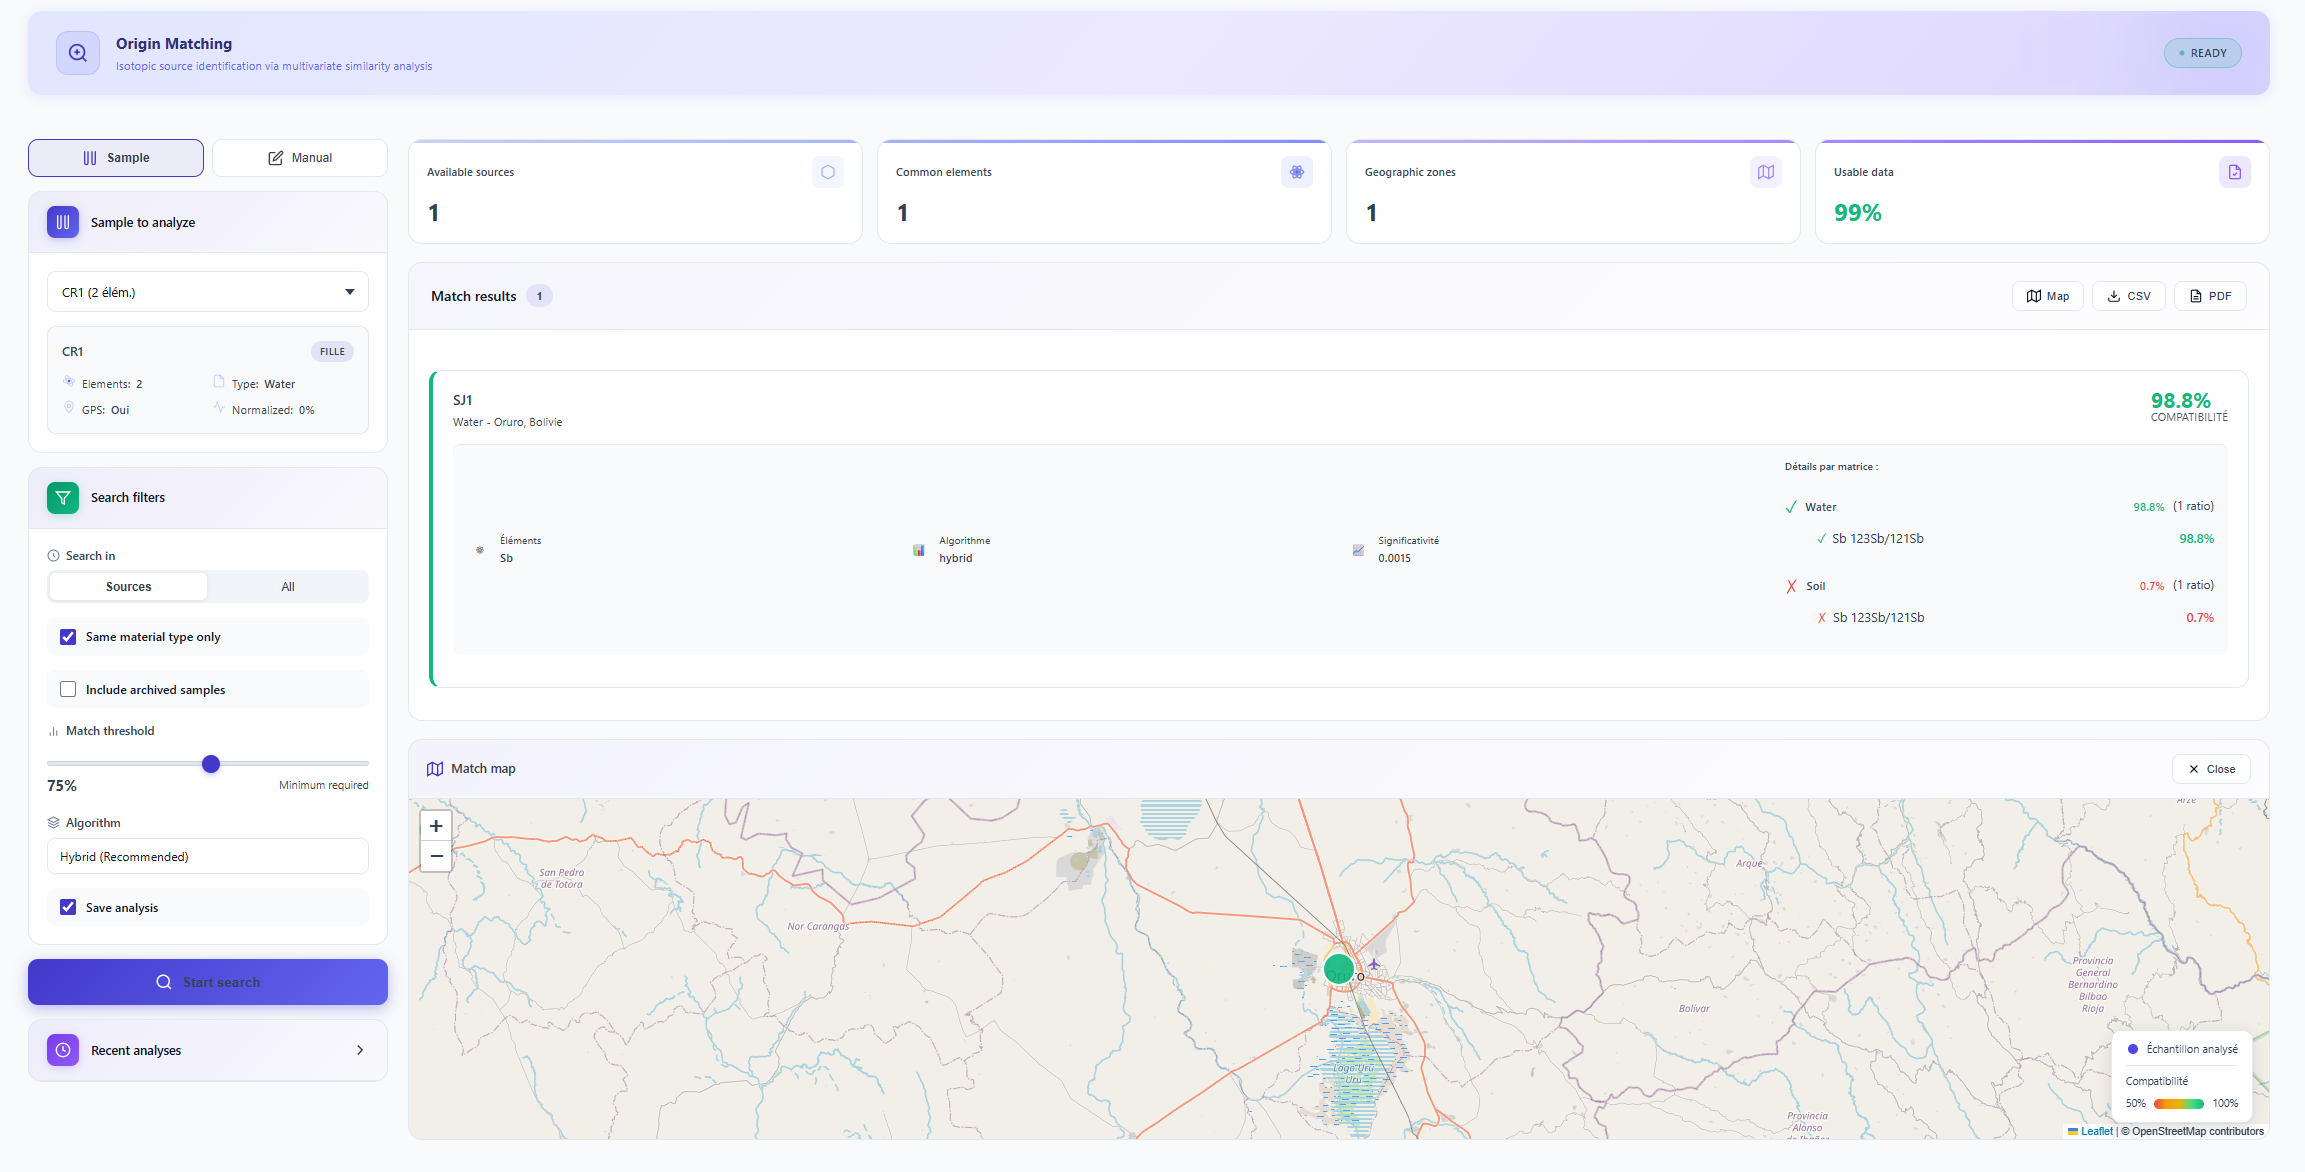
Compare the isotopic signature of a delivered batch to the reference of the declared mine or supplier. IsoFind automatically flags any significant deviation. The answer is binary and defensible: compliant or non-compliant, backed by data. A direct response to the due diligence obligations of the Critical Minerals Act and the growing demands for supply chain transparency.
Every industrial process slightly modifies the isotopic signature of a material. The Nexus module lets you visually simulate these transformations step by step, from raw ore to finished component, predicting the expected output signature.
Every received batch is recorded with its signature. If a supplier quietly changes their supply source, the deviation from historical data is automatically detected on the next batch.
Every action is timestamped and attributed to its author: imports, edits, exports, logins. This permanent log is exportable and constitutes a defensible activity record for any certification audit or regulatory procedure.
Lock access with a password, encrypt your local database, manage user roles (analyst, manager, admin) and active sessions. The database can be backed up and restored in one click, including in air-gap or isolated-site environments.
IsoFind exposes a complete local REST API, documented in real time via Swagger. Query the database, trigger analyses, export results or integrate IsoFind into your existing processing pipelines from any Python script or third-party tool.
Typical workflow in IsoFind
Secure your supply chain and automate your controls.
IsoFind Pro includes the full audit trail, database protection, multi-user management and REST API access to integrate IsoFind into your existing systems.Isotopic signatures are intrinsic to materials: they do not change over time, are invisible to the naked eye, and cannot be copied without specialist equipment. IsoFind lets you build an authenticity reference for your products and compare each sample to that reference, concluding objectively and in a documented way to either conformity or fraud.
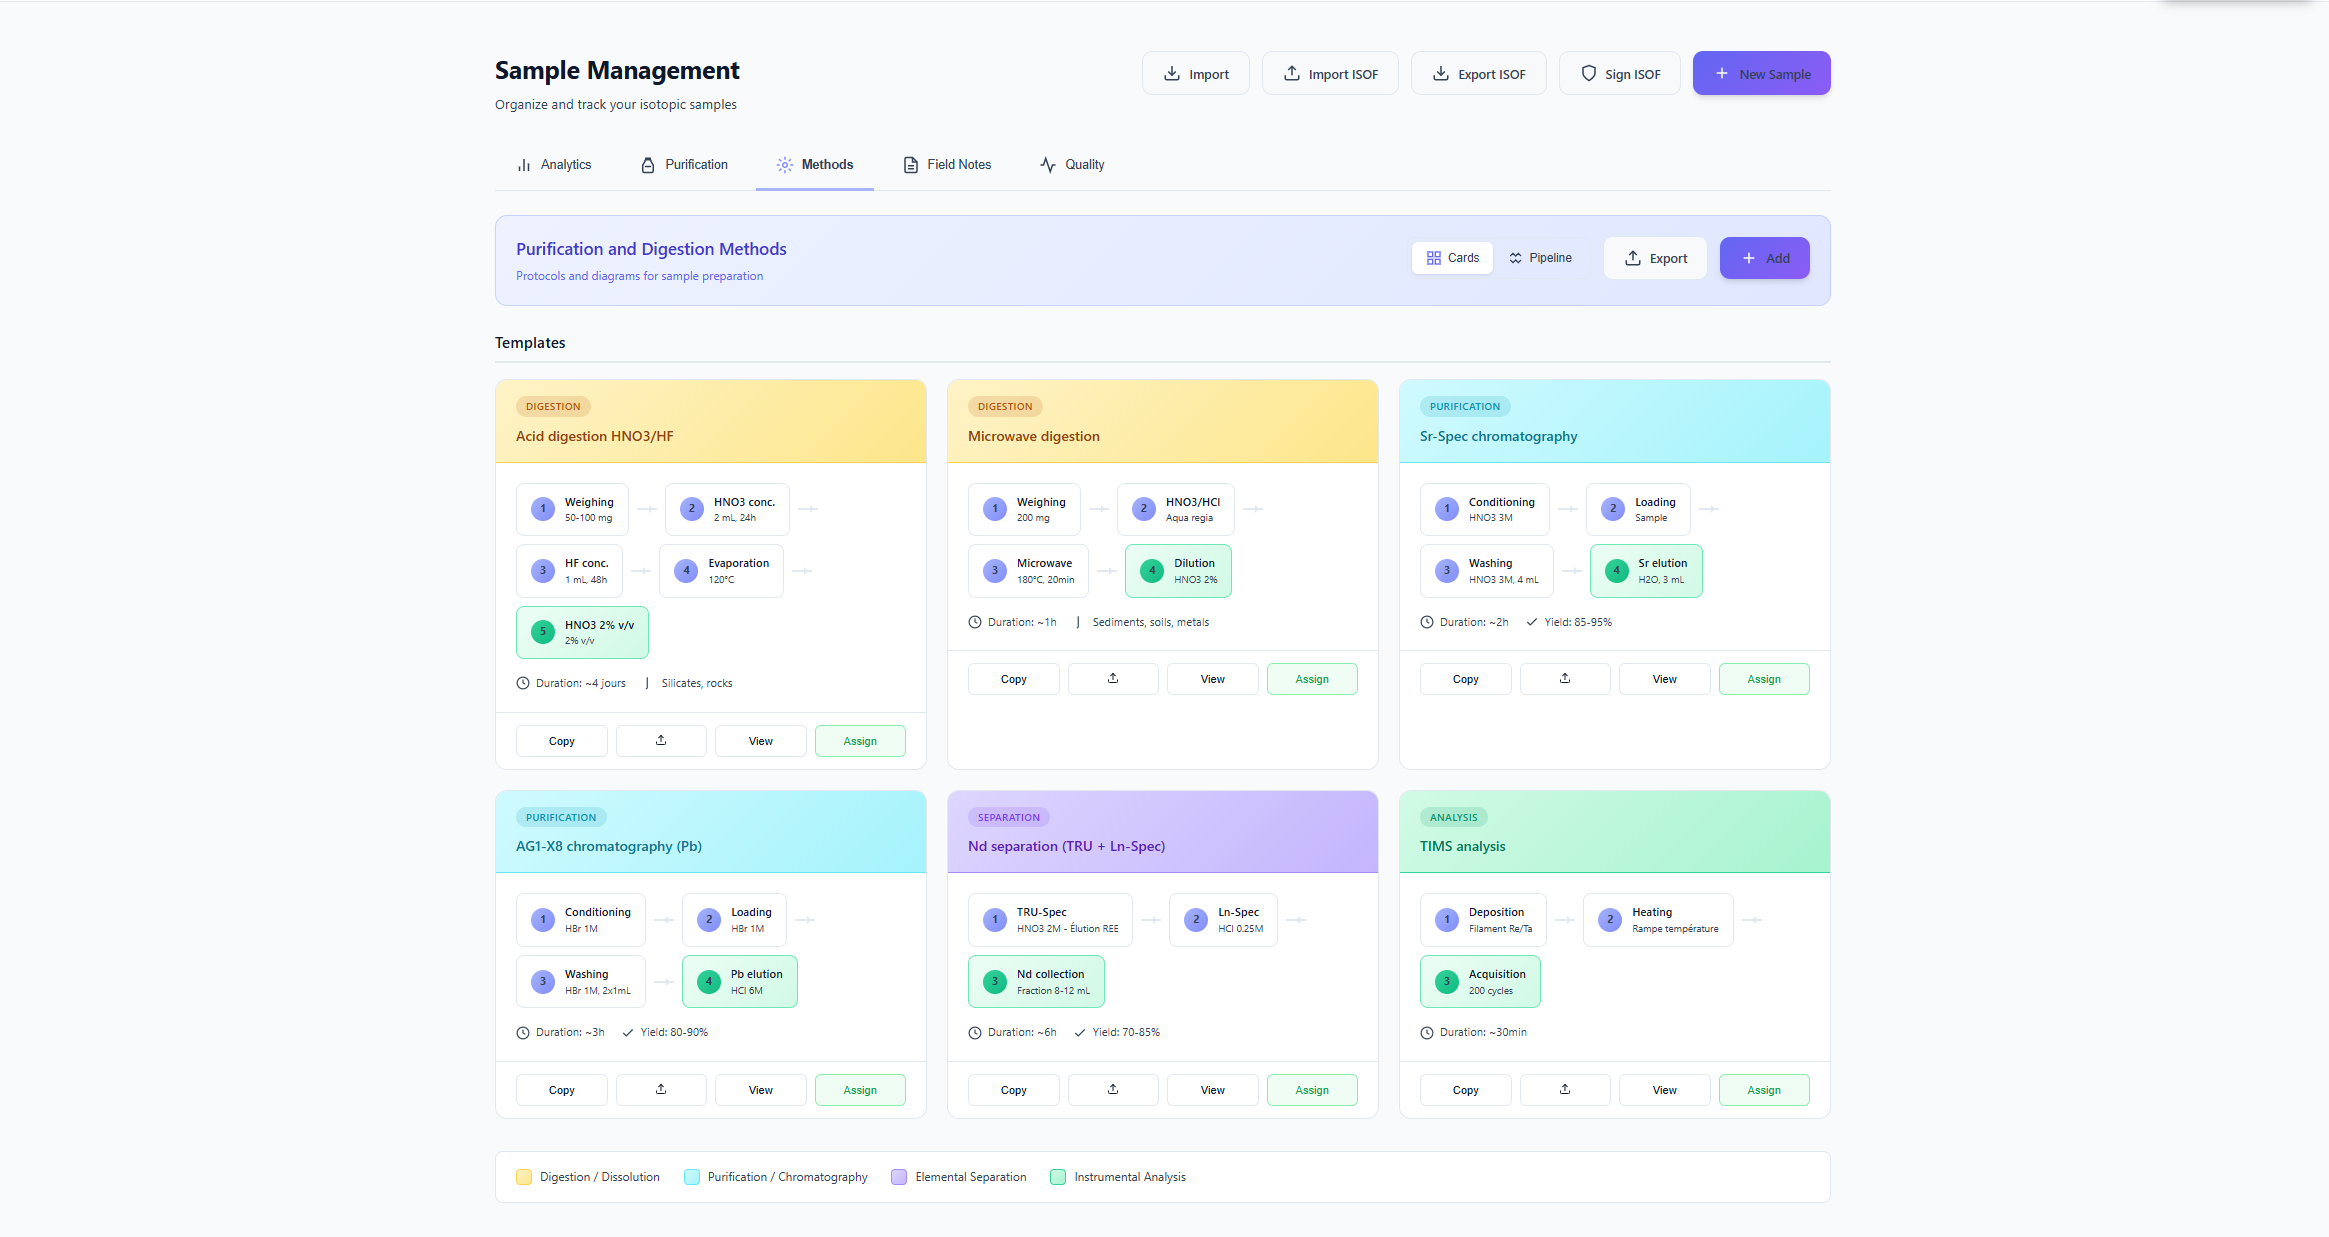
A product cut with a cheaper material presents a mixed isotopic signature, measurable and quantifiable. IsoFind automatically detects any sample whose signature departs from the authentic product's reference, calculates the fraud probability and estimates the adulterant proportion. The conclusion is clear and backed by data.
Compile signatures from your authentic products by batch, vintage or production site. IsoFind automatically calculates the statistical envelopes that define the acceptable signature of a compliant product.
Two materials of identical chemical composition but from different geographical origins have distinct isotopic signatures. IsoFind enables this discrimination where all other analytical methods fail.
For products without a sufficient natural fingerprint, IsoFind guides the design of active marking: controlled introduction of a specific isotopic ratio during manufacturing, impossible to reproduce without dedicated equipment.
Every conclusion comes with a complete record: method applied, reference used, comparison statistics, full history. Structured for presentation to a certification body or a court.
Typical workflow in IsoFind
Protect your brand and your customers with scientific evidence.
IsoFind lets you build your authenticity reference and set up regular controls.IsoFind is designed by geochemists for the demands of research laboratories: management of thousands of samples with complete metadata, fractionation modelling, geochemical machine learning, GeoReM and CRM compatibility, CSIA analysis of organic molecules, predictive 3D modelling of aquifers, and a plugin system to extend analytical capabilities to your own methods.
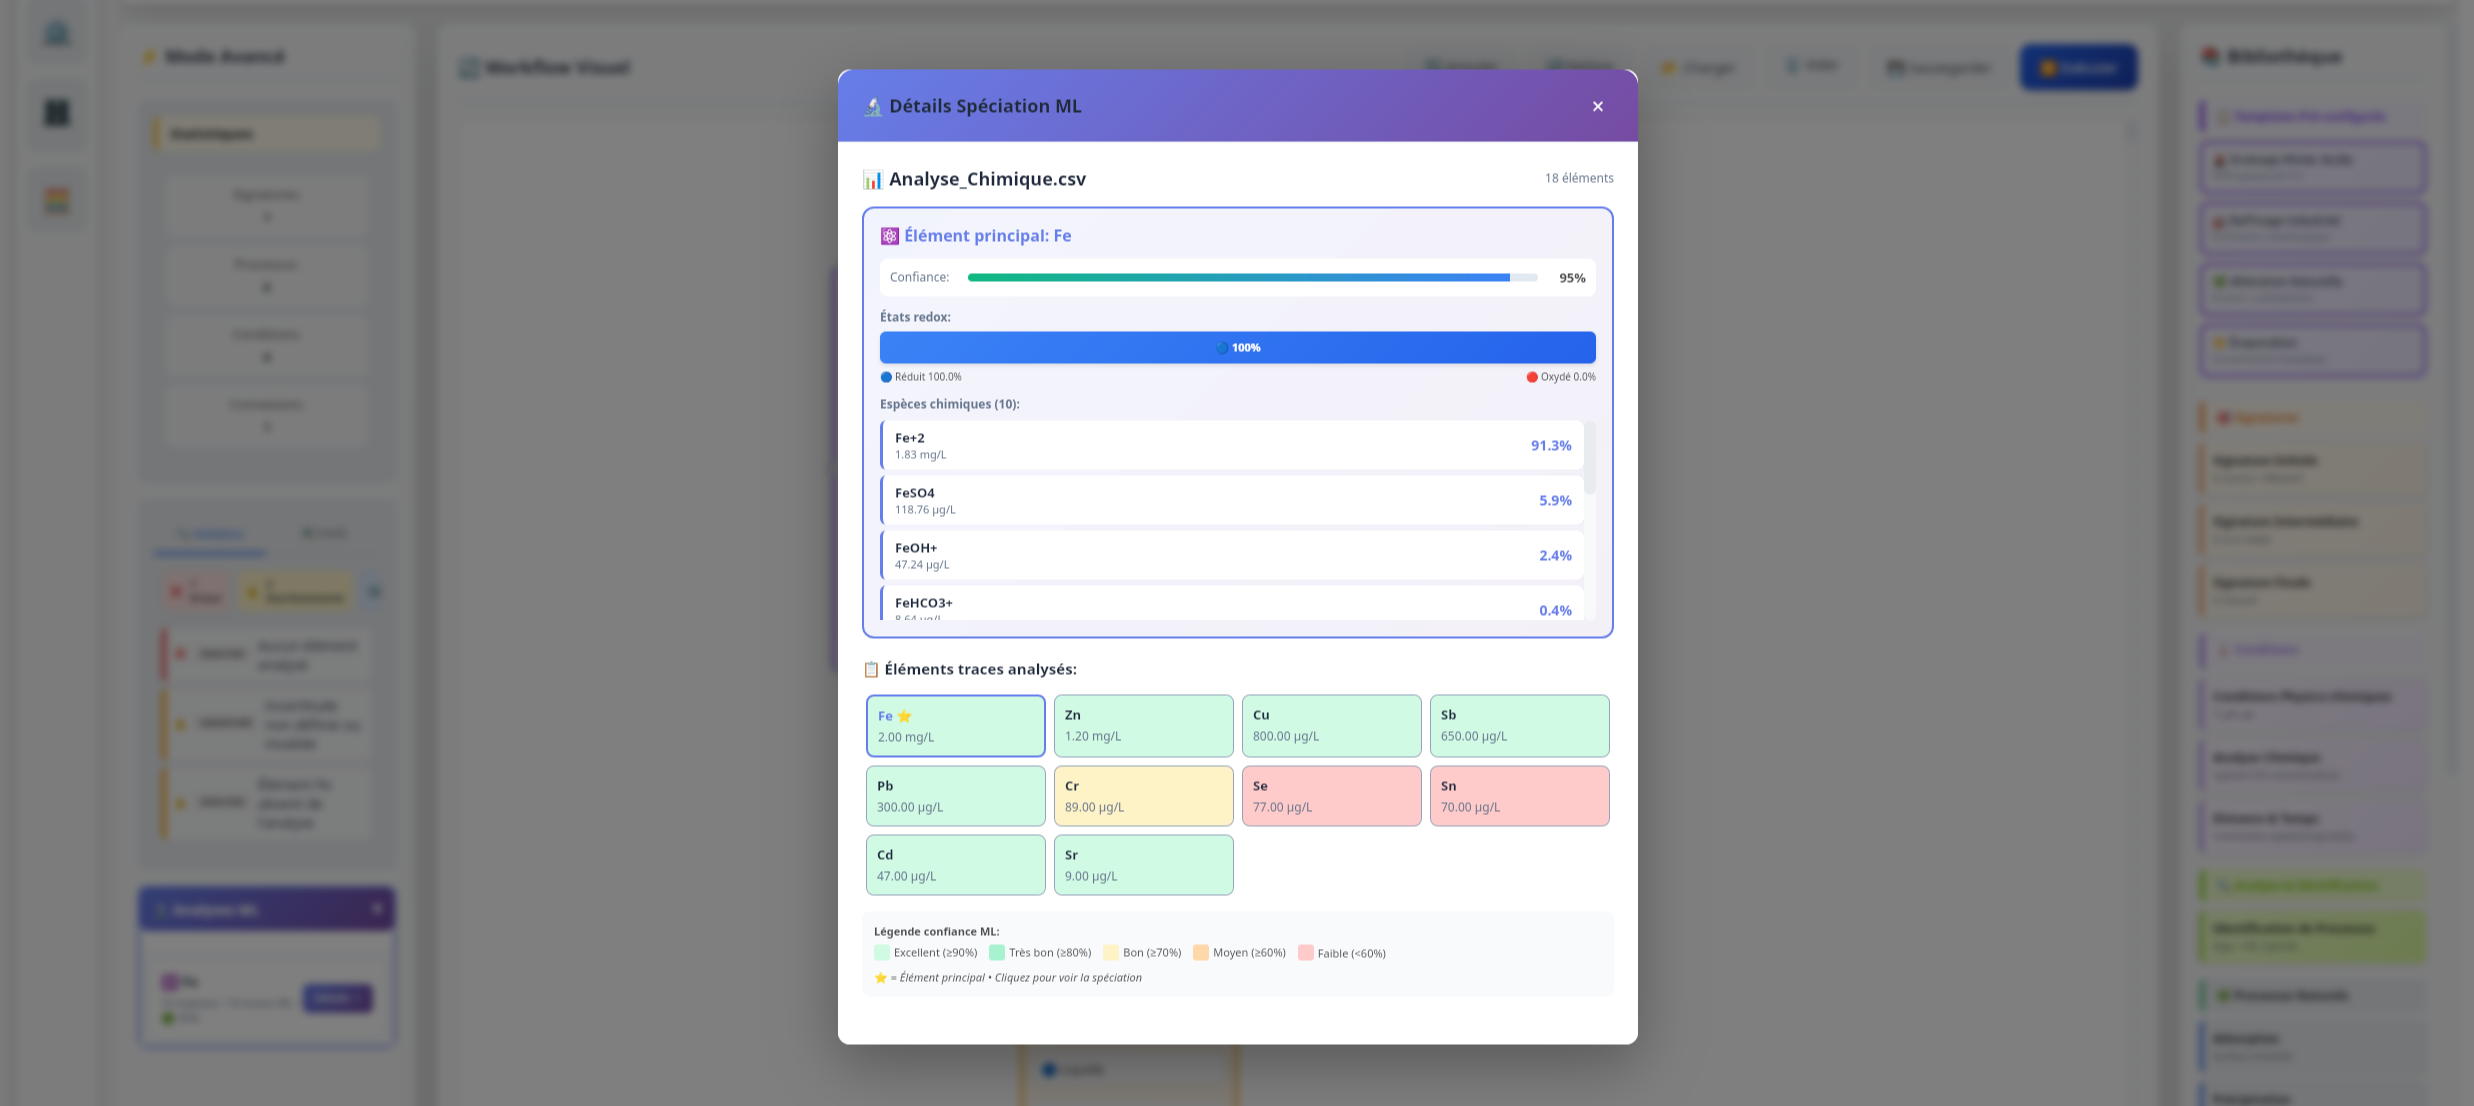
IsoFind's ML engine, trained on millions of published geochemical data points and synthetic PHREEQC simulations, identifies geological contexts, predicts speciation and adsorption of trace elements (Cr, Fe, As, Sb...) and organic molecules (TCE, PCE, BTEX), and anticipates isotopic behaviours in different environments. Every suggestion is accompanied by its scientific justification.
Store, normalise and query thousands of samples with their complete metadata, including geochemical data, organic molecules and field physico-chemical conditions. GeoReM and CRM compatible, the database is SQLite: portable, durable and exportable.
Bi-isotopic diagrams, ternary plots, isotopic PCA, fractionation graphs. Interactive for exploration, exportable as SVG vector graphics for publications or high-resolution 300 dpi PNG for posters and reports.
Import, normalise and compare compound-specific isotopic data (delta 13C, delta D, delta 37Cl) for chlorinated solvents, hydrocarbons, PFAS and pesticides. The CSIA module provides the molecule datasheet (formula, m/z, isotopic link), the Rayleigh model to quantify degradation, and suggestions of isotopic systems based on the study context.
Reconstruct the contamination plume in 3D (IDW) and simulate its temporal evolution via the coupled predictive pipeline: geochemical prior (Rayleigh, mixing, Cr/Fe reduction, TCE/PCE degradation) plus ONNX ML on residuals, with a pH x Eh lookup table for simulation and direct ONNX call for detailed speciation tooltips. Time slider, cross-section, PNG export.
Model equilibrium and kinetic isotopic fractionations using Rayleigh equations and box models. Compare predictions to measured values to validate or invalidate your process hypothesis. Integrated into the Nexus workflow for industrial transformation chains.
Generate complete PDF reports from a block editor: cover page, sample inventory, isotopic signatures, Nexus conditions, ML speciation, attribution scores, uncertainties and SHA-256 certification. Templates are customisable and reports are cryptographically sealed for judicial and regulatory uses.
Integrate your own Python or R scripts as plugins. Share your methods with the community or keep them private. Each plugin is isolated from the software core to guarantee stability.
Typical workflow in IsoFind
IsoFind Research is free for public research institutions.
Access the full documentation and explore the shared community database.Food products carry an isotopic fingerprint linked to the soil, water and climate of their production area. This fingerprint does not lie. A cut, substituted or mislabelled product shows a signature that departs from that of the authentic product. IsoFind lets you build your appellation's reference and control each incoming or suspect batch.
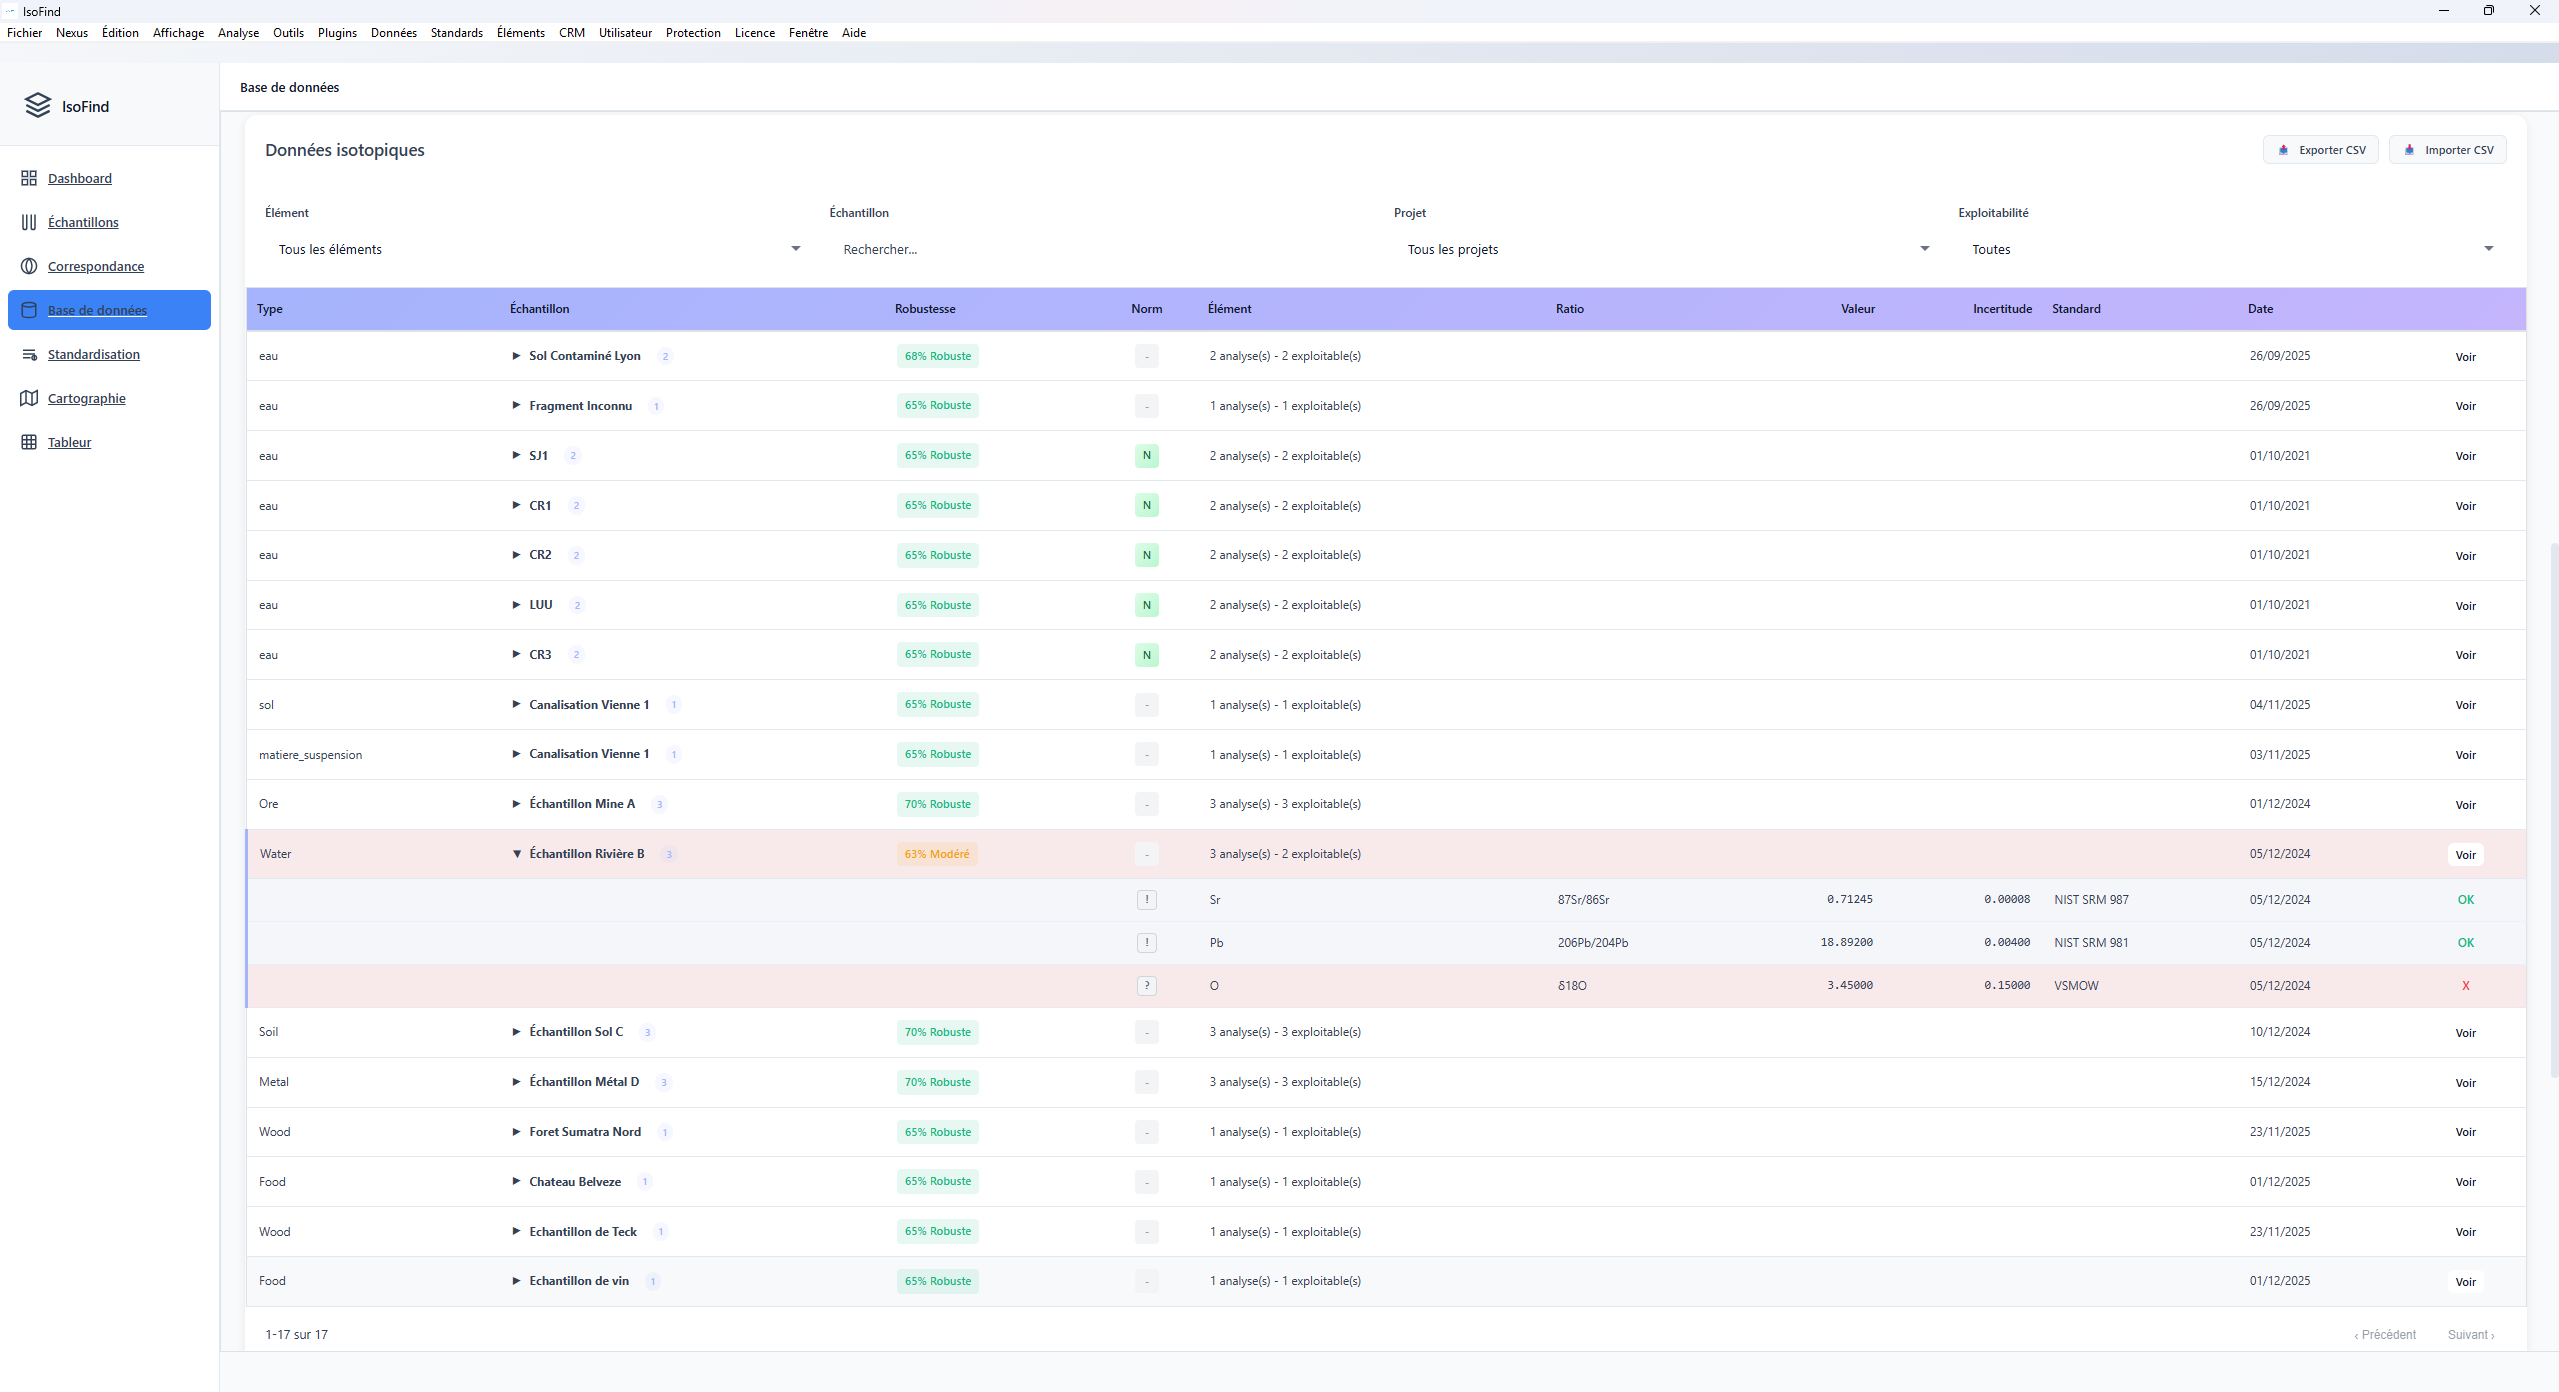
A product diluted with cheaper oil, synthetic honey or wine from another region presents a composite isotopic signal that IsoFind automatically decomposes. The software calculates the adulterant proportion and identifies its probable nature from candidate source signatures. The conclusion is immediate, documented and exportable.
Detection and quantification of the adulterantOxygen and hydrogen isotopes reflect the local water signature. Carbon and nitrogen isotopes reflect the type of vegetation and agricultural practices. IsoFind compares each sample to the declared region's reference.
Each climate year leaves a specific isotopic fingerprint in plant products. IsoFind lets you progressively build your own signature database by vintage and verify, batch by batch, the concordance between the declared year and the measured signature.
Progressively compile the authentic signature base for your appellation, manage natural inter-annual variability and statistically define the limits of what is typical for your terroir.
Nitrogen isotopes can discriminate chemically fertilised crops from organic ones. This analysis is achievable in IsoFind via a dedicated plugin, as a complement to standard documentary controls, adding an objective analytical proof to your certification dossier.
Typical workflow in IsoFind
Protect your producers and the reputation of your appellation.
IsoFind supports you from building the reference to regular batch controls, with reports adapted to certification bodies.Archaeological materials and biological remains carry an isotopic memory of their place of origin and history. This memory allows us to retrace ancient trade routes, the provenance of raw materials used by craftspeople, population migrations or authenticate works of art. IsoFind structures these analyses in a rigorous, documented and shareable framework.
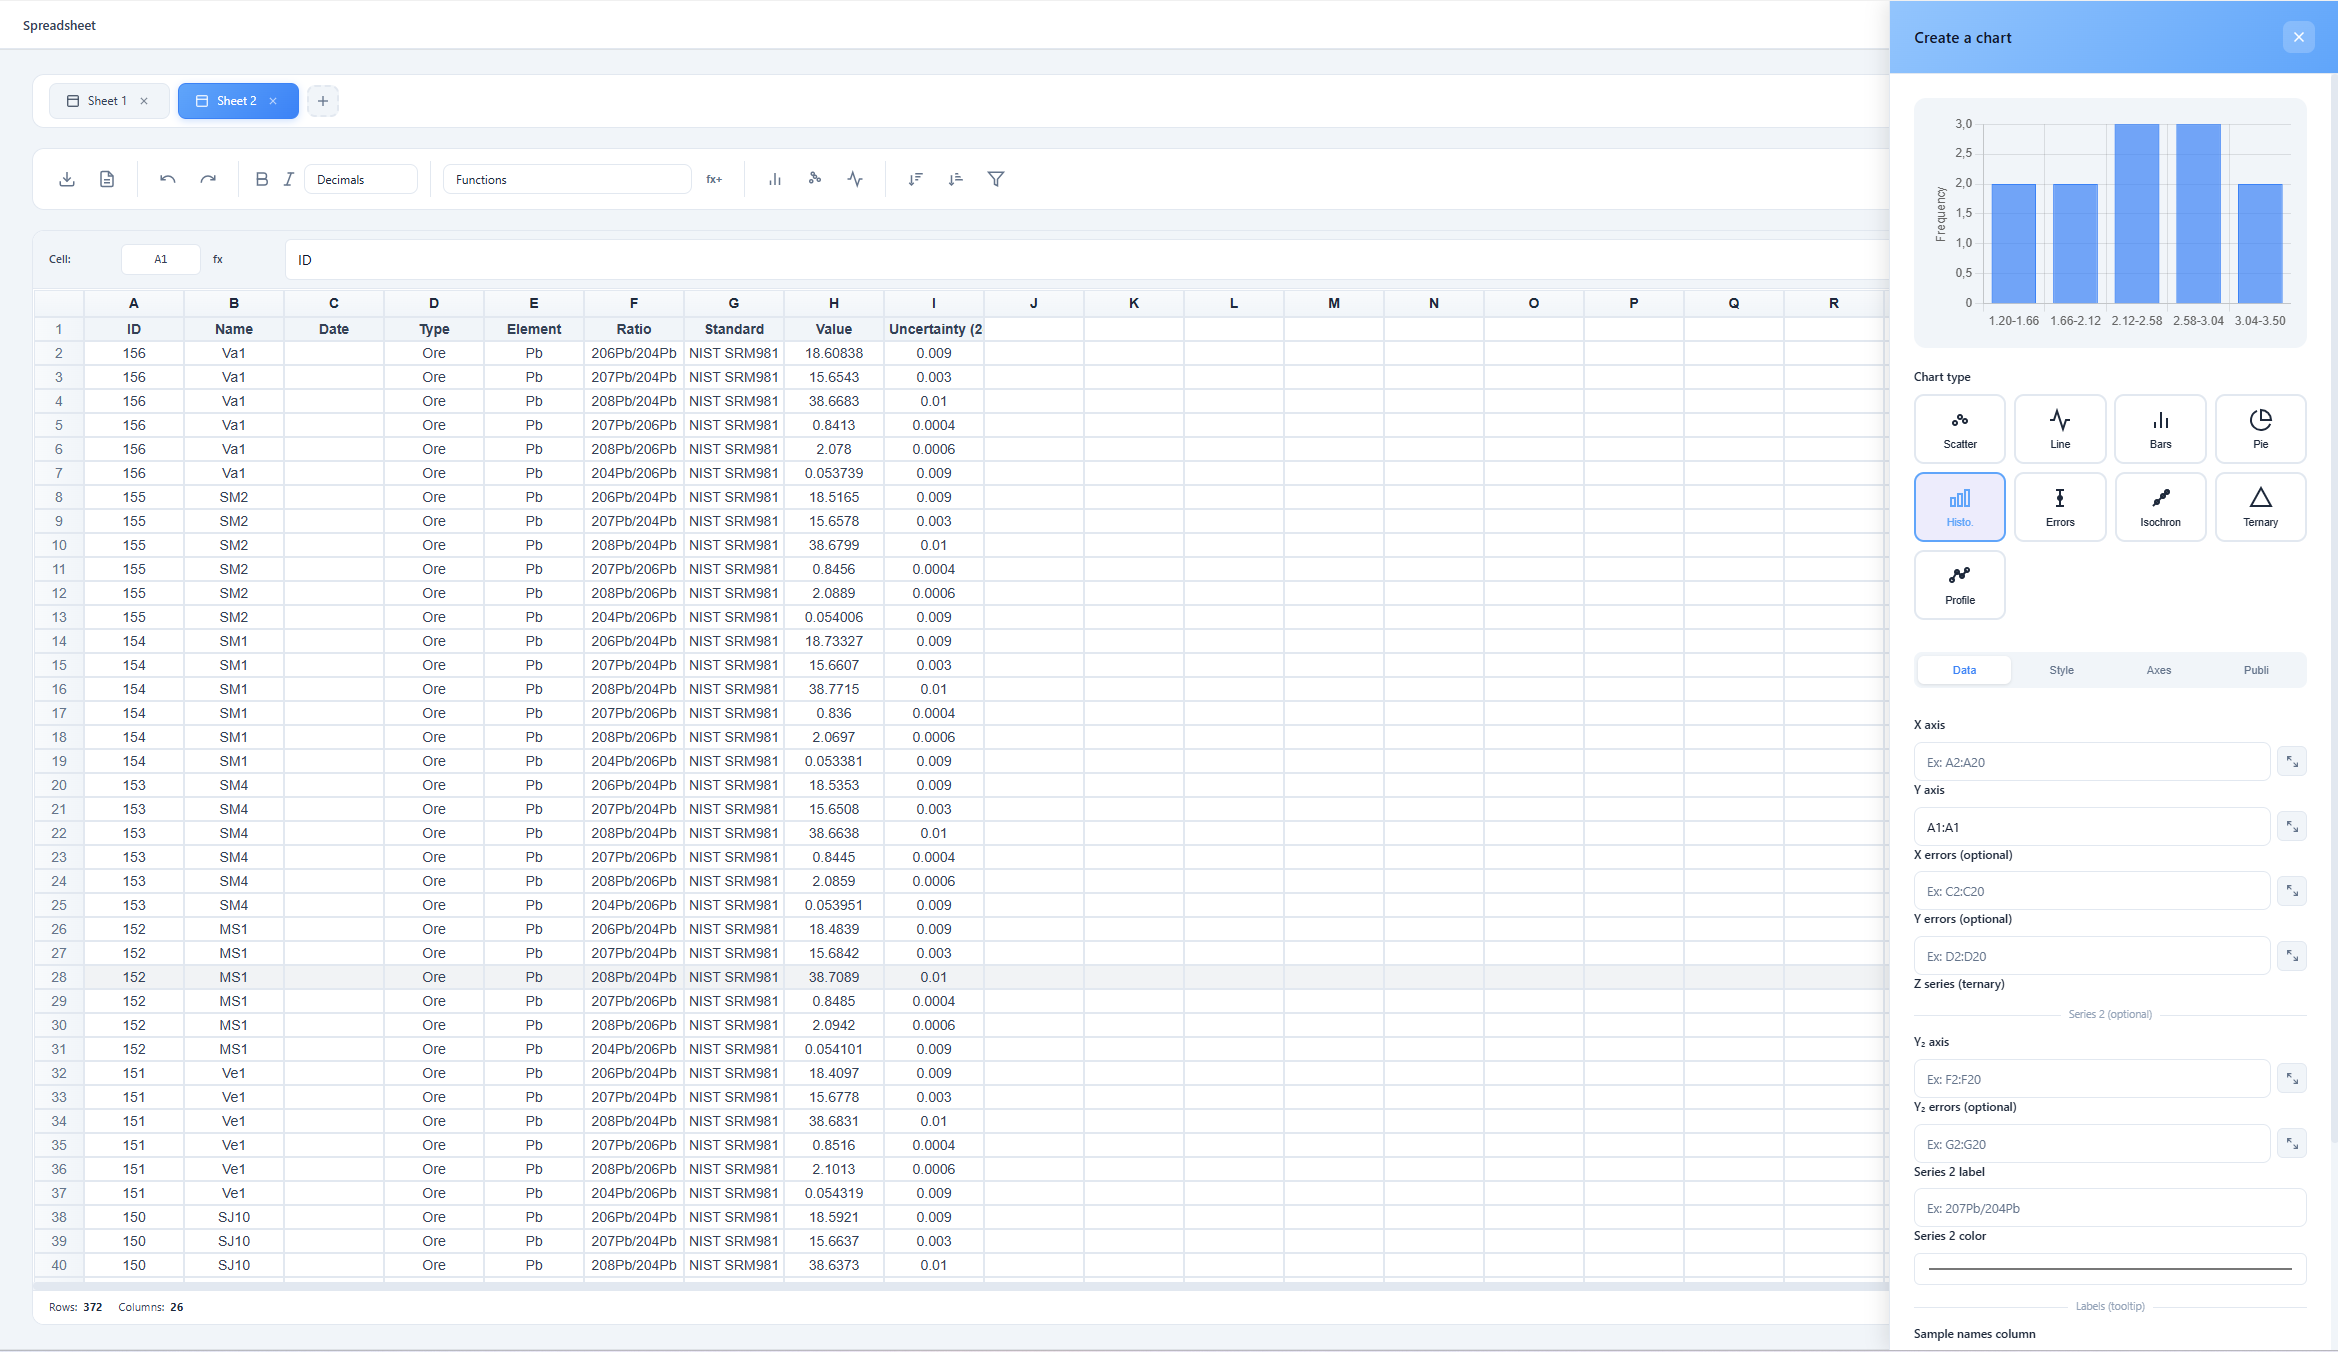
Identify the geological origin of a metal, marble or clay by comparing its isotopic signature to the fingerprints of known deposits and quarries from the period. IsoFind manages provenance reference databases and calculates the probability of belonging to each candidate source, accounting for analytical uncertainty and the natural variability of deposits.
Geological origin identification of a materialLead isotopes (206Pb/204Pb, 207Pb/204Pb, 208Pb/204Pb) vary according to the geological age and composition of source rocks. IsoFind allows comparison of the lead signature of a metal object, pigment or glass against ancient mining and geological reference databases to identify its probable ore deposit and retrace supply circuits.
The pigments, binders and supports of a work carry an isotopic fingerprint consistent with their era and place of production. IsoFind detects anachronistic or geographically incompatible compositions with the declared attribution.
Carbon and nitrogen isotopes in bone collagen reflect the dietary habits of an individual's last years of life. IsoFind manages palaeoecological series and compares signatures to available resource references.
Associate each piece with its isotopic data, analytical method and provenance conclusions. Records are archivable in .isof format and can be integrated into collection management systems.
Typical workflow in IsoFind
An archaeological or heritage project underway?
Contact us to discuss your use case and discover how IsoFind can integrate into your workflow.When point data is no longer enough to understand a subsurface plume, three-dimensional modelling changes the scale of perception. IsoFind reconstructs the contamination volume by spatial interpolation, couples it to a geochemical prediction engine (physical prior + ML ONNX) and lets time scroll to show how the contaminant evolves. PFAS and pesticide tracing is available free of charge.
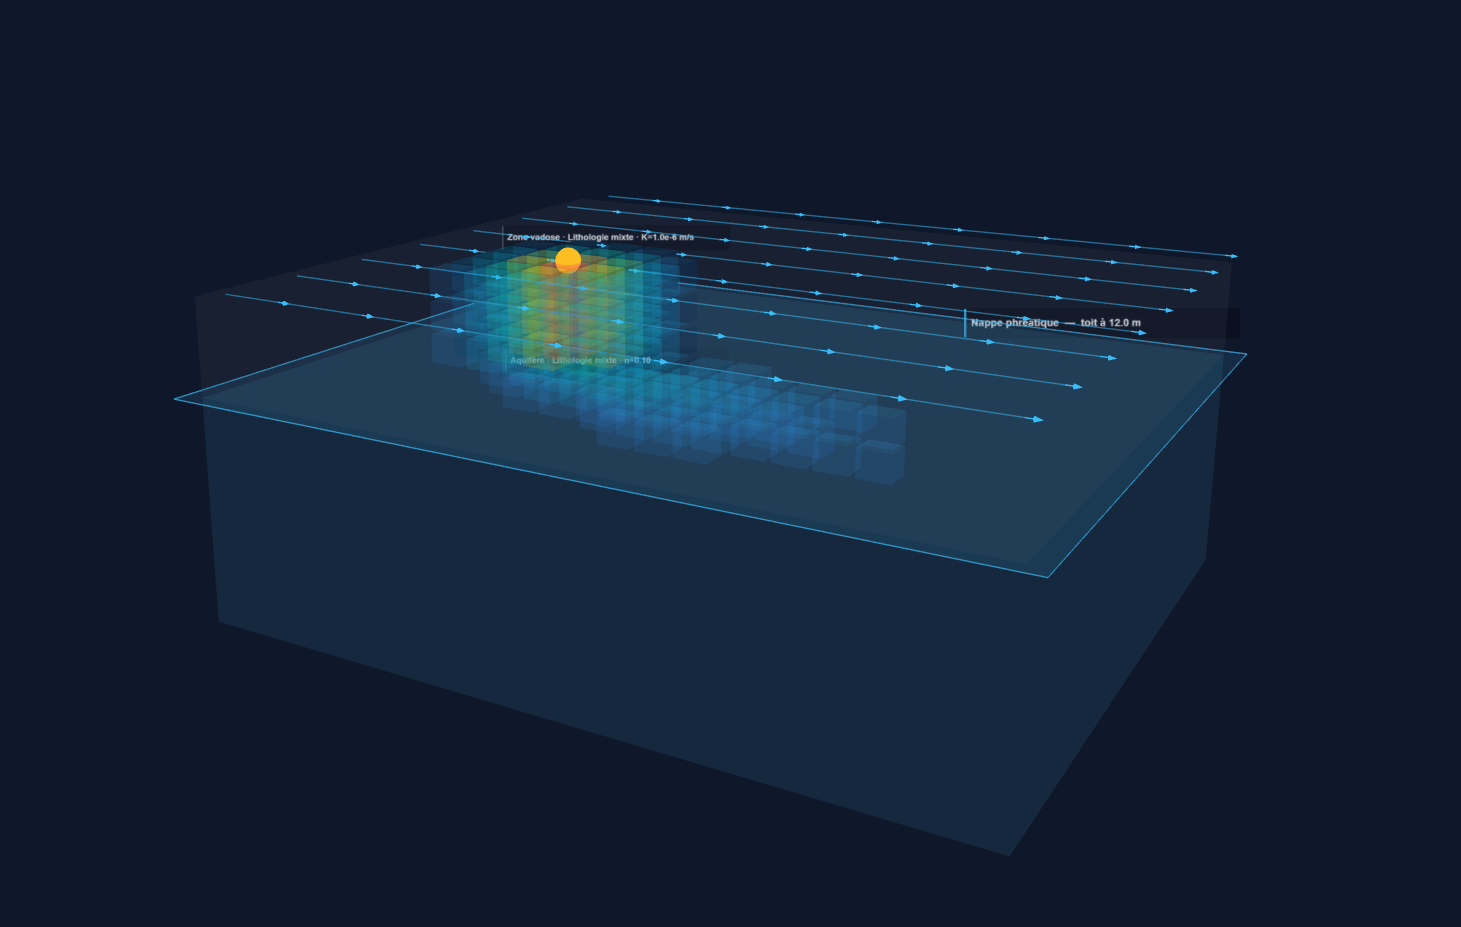
From your point data (wells, piezometers, soil samples), IsoFind interpolates concentrations in 3D using the IDW (Inverse Distance Weighting) method and displays the contamination volume with its colour gradient. Two visualisation modes: coloured point cloud for rapid exploration, interpolated volume for presentations. Geographic coordinates are locally normalised with cos(lat) correction to guarantee distance accuracy.
The predictive engine calculates the plume's evolution over time, accounting for advective transport, adsorption onto soil minerals and degradation. A time slider allows stepping through the simulation stages, from initial state to the predictive horizon. Front velocity is calculated from hydraulic conductivity and gradient, corrected for dilution and retardation effects.
The predictive engine combines a calculable physical prior (Rayleigh, 2 end-member mixing, Cr(VI)/Cr(III) reduction, TCE/PCE/DCE degradation) and two dedicated ONNX models: an elements model (redox speciation, Kd adsorption) and an organic molecules model (reaction rate k, effective epsilon). A 936-point pH x Eh lookup table is pre-calculated at startup for fast simulation; direct ONNX call remains available for detail tooltips.
Slice the 3D volume at any depth with the horizontal cross-section. The Z slider allows scrolling through layers and reading predicted concentrations at each depth. Useful for delimiting risk horizons in a multi-layer aquifer or targeting sampling depths during a field campaign.
Click on any point in the 3D volume to instantly obtain the interpolated local geochemical conditions (pH, Eh, DO) and predicted speciation: Cr(VI)/Cr(III) or TCE/DCE/VC fractions depending on the molecule, local partitioning coefficient Kd, kinetic constant k_reaction, and estimated mobility. This information directly feeds risk assessment reasoning and the prioritisation of sampling points.
The depth axis is often much more compressed than the horizontal axes in an aquifer. The vertical exaggeration cursor (x1 to x10) makes structures readable without distorting the interpretation. High-resolution PNG export produces an image directly usable in a report or presentation.
Typical workflow in IsoFind
Visualise your data in 3D, free for PFAS and pesticides.
Download IsoFind. 3D modelling for PFAS and pesticides is included without a licence. The full predictive engine (chlorinated solvents, metals, hydrocarbons) is available in Pro.An IsoFind report is not a formatted document. It is a structured reasoning: it automatically compares multiple attribution hypotheses, argues for and against each, quantifies confidence in each conclusion, delimits what the data supports and what it does not, and seals everything cryptographically. Every assertion is factual, analytically grounded and traced back to the raw measurement.
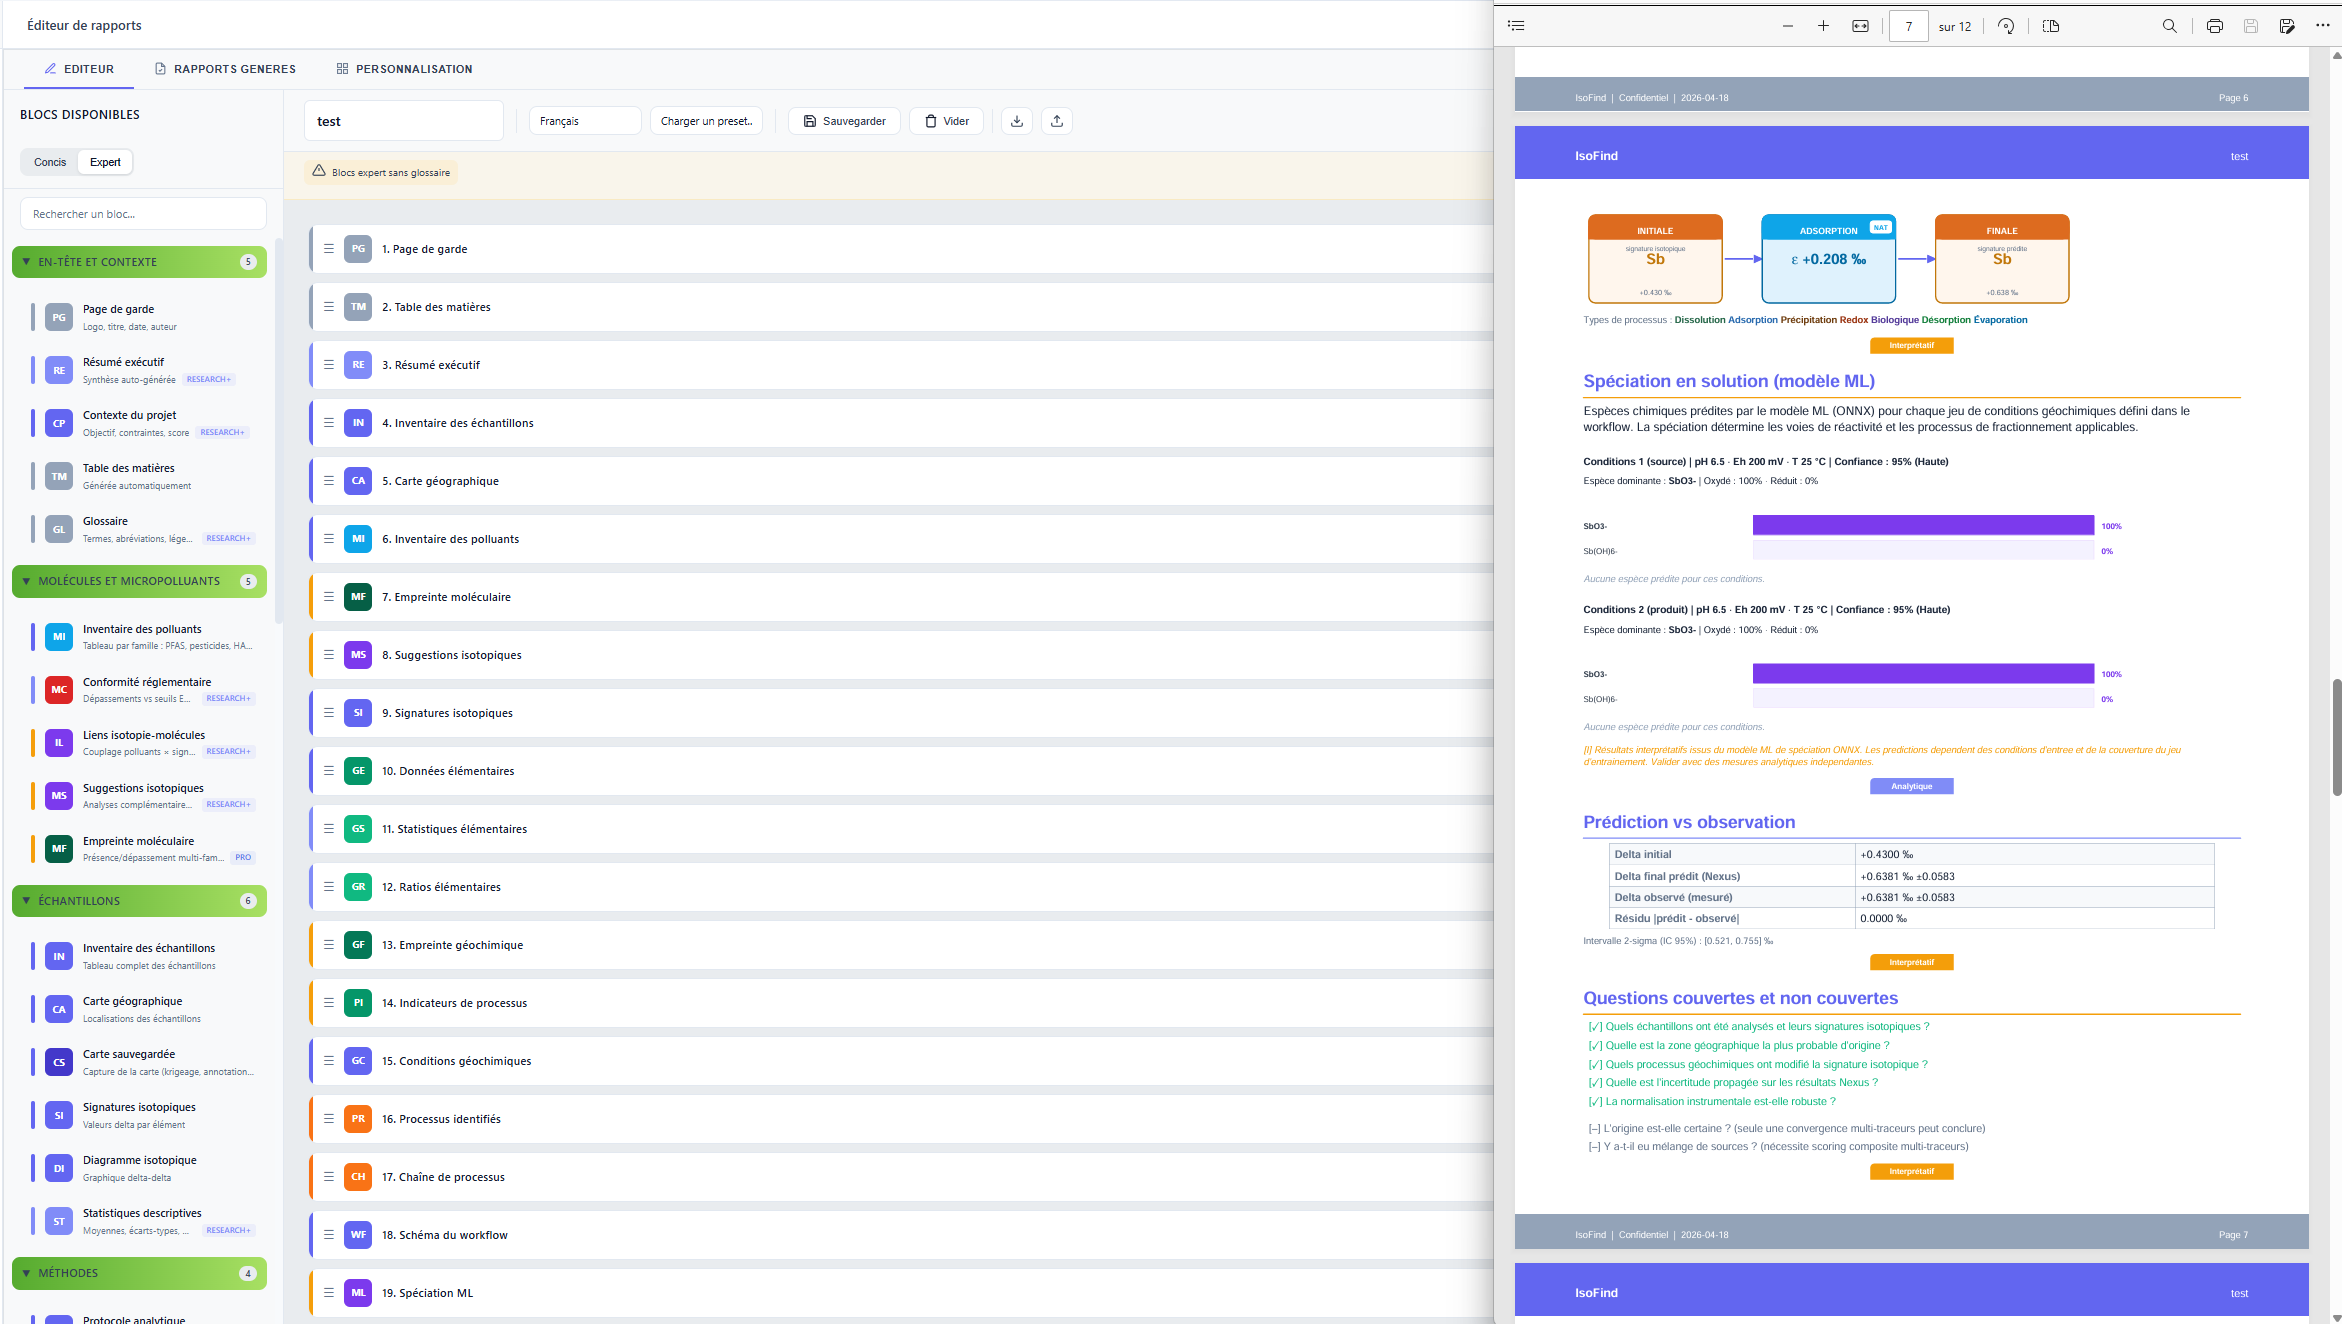
The FAIH framework
For each attribution question (what is the probable source? is this batch compliant?), IsoFind simultaneously evaluates all candidate scenarios. Each hypothesis receives a confidence score calculated from the isotopic distance to the reference, the consistency of tracer systems and statistical robustness. The report presents the arguments for and against each scenario, the score for each, and concludes on the most probable scenario, without hiding credible alternatives.
Confidence score per hypothesis, argued and traceableEvery report includes a structured section explicitly listing what the data allows to conclude with confidence, what it allows to suggest with reservation, and what it cannot resolve. This rigorous delimitation of conclusions is what makes a report defensible in judicial or regulatory contexts, where an unsupported conclusion is more damaging than no conclusion at all.
ML speciation results, Nexus fractionations, concentration/time curves from the 3D simulation and attribution scores are all automatically collected and inserted into the corresponding blocks. No manual re-entry, no copy-paste: the report is a coherent projection of the entire analytical workflow.
Compose your reports from reorderable thematic blocks: cover page, sample inventory, isotopic signatures, Nexus processes, ML speciation, 3D simulation, attribution scores, uncertainties, recommendations, free sections, glossary, bibliography. Three pre-configured templates cover common uses; create and save your own.
Every generated PDF is sealed by a SHA-256 hash covering all content. Any subsequent modification is immediately detectable. For judicial or regulatory use, this mechanism constitutes an enforceable integrity proof without third-party infrastructure. The audit trail records every action: generation, export, download, deletion.
Preview the report block by block before generating. Export as a downloadable PDF or in sealed .isof format for archiving or sharing with a partner laboratory. The report can be regenerated identically from the original data to document the evolution between two campaigns.
What no other tool produces
Typical workflow in IsoFind
A report that argues, not just presents.
The full module (multi-scenario analysis, answers/does not answer section, SHA-256 sealing, audit trail) is available under Pro licence.IsoFind Research covers the full daily isotopic workflow: guided import with error detection, database management for thousands of samples, geochemical spreadsheet, built-in isotopic tools, cartography and publication-ready visualisations. PFAS and pesticide tracing (CSIA delta 13C / delta 37Cl) and 3D visualisation of PFAS and pesticide plumes are included free of charge. Data stays on your machine, no connection required.
The Pro version adds CSIA for all organic molecules, full predictive 3D modelling, isotopic fractionations, advanced geochemical machine learning, reports with SHA-256 sealing and full audit trail, and multi-user features.