Thursday, 18 June, 2026
IsoFind combines geochemistry, isotopic signatures and spatio-temporal simulation to predict where, when and at what concentration a pollutant will impact your environment.
PFAS and pesticide tracing is available free of charge to everyone.
Classical investigation methods produce a snapshot of the situation at a given moment. They do not say where the pollutant will be tomorrow, nor when it will reach the downstream abstraction point.
Understanding a contamination is no longer enough. You need to anticipate its behaviour.
Isotopic signatures are not merely a tracing tool. They constrain sources, processes and mixing, making simulation scenarios consistent with field reality.
Isotopic signatures (delta ¹³C, delta ³⁷Cl, delta D...) allow sources to be discriminated, mixtures to be quantified and active processes to be identified. Every simulation scenario is anchored in these measured observations.
IsoFind integrates the mechanisms of transport, transformation (biodegradation, oxidation, reduction, adsorption) and storage of contaminants. The Nexus engine propagates isotopic fractionations node by node as the pollutant migrates.
The system simulates the spatio-temporal evolution of the plume and generates actionable predictive scenarios: concentration/time curves at sensitive receptors, mapping of risk horizons, estimation of impact timelines.
Four types of information that the simulation produces and that classical methods cannot provide.
Visualise the probable trajectories of the contaminant in the subsurface, identify preferential pathways and accumulation zones before abstraction points are affected.
Identify when a sensitive receptor will be impacted: abstraction well, wetland, agricultural drain. Plan remediation or operation accordingly, with a quantified intervention window.
Estimate expected concentrations at sensitive receptors and anticipate whether regulatory thresholds will be exceeded. Distinguish critical situations from manageable ones before they materialise in the field.
Detect active transfer zones and horizons where the contaminant preferentially accumulates. Target remediation actions on the sectors that genuinely contribute to the flux, not across the entire site.
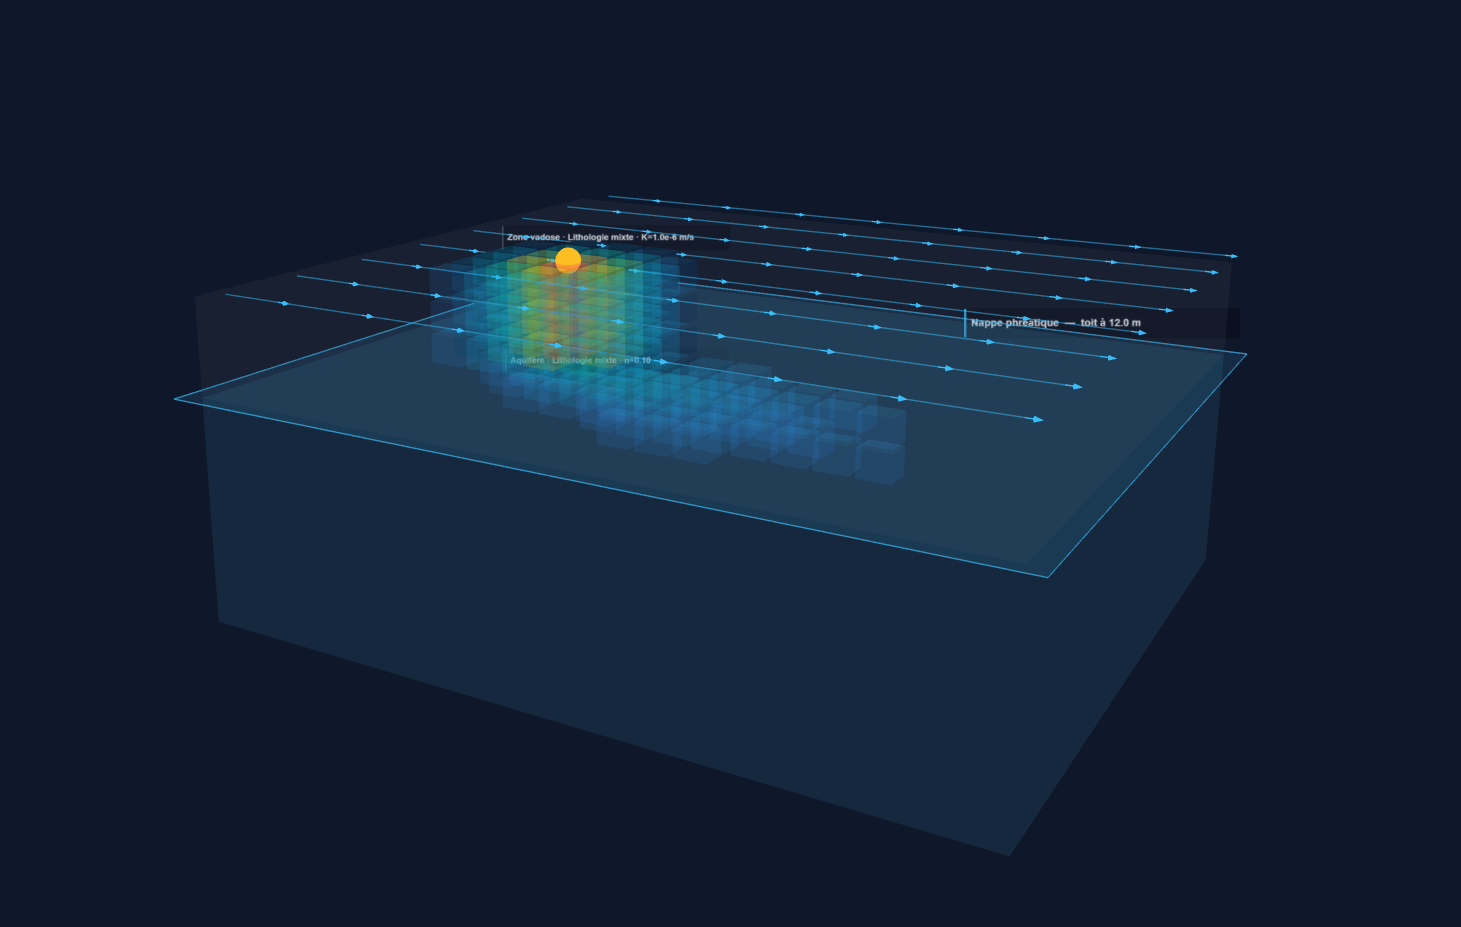
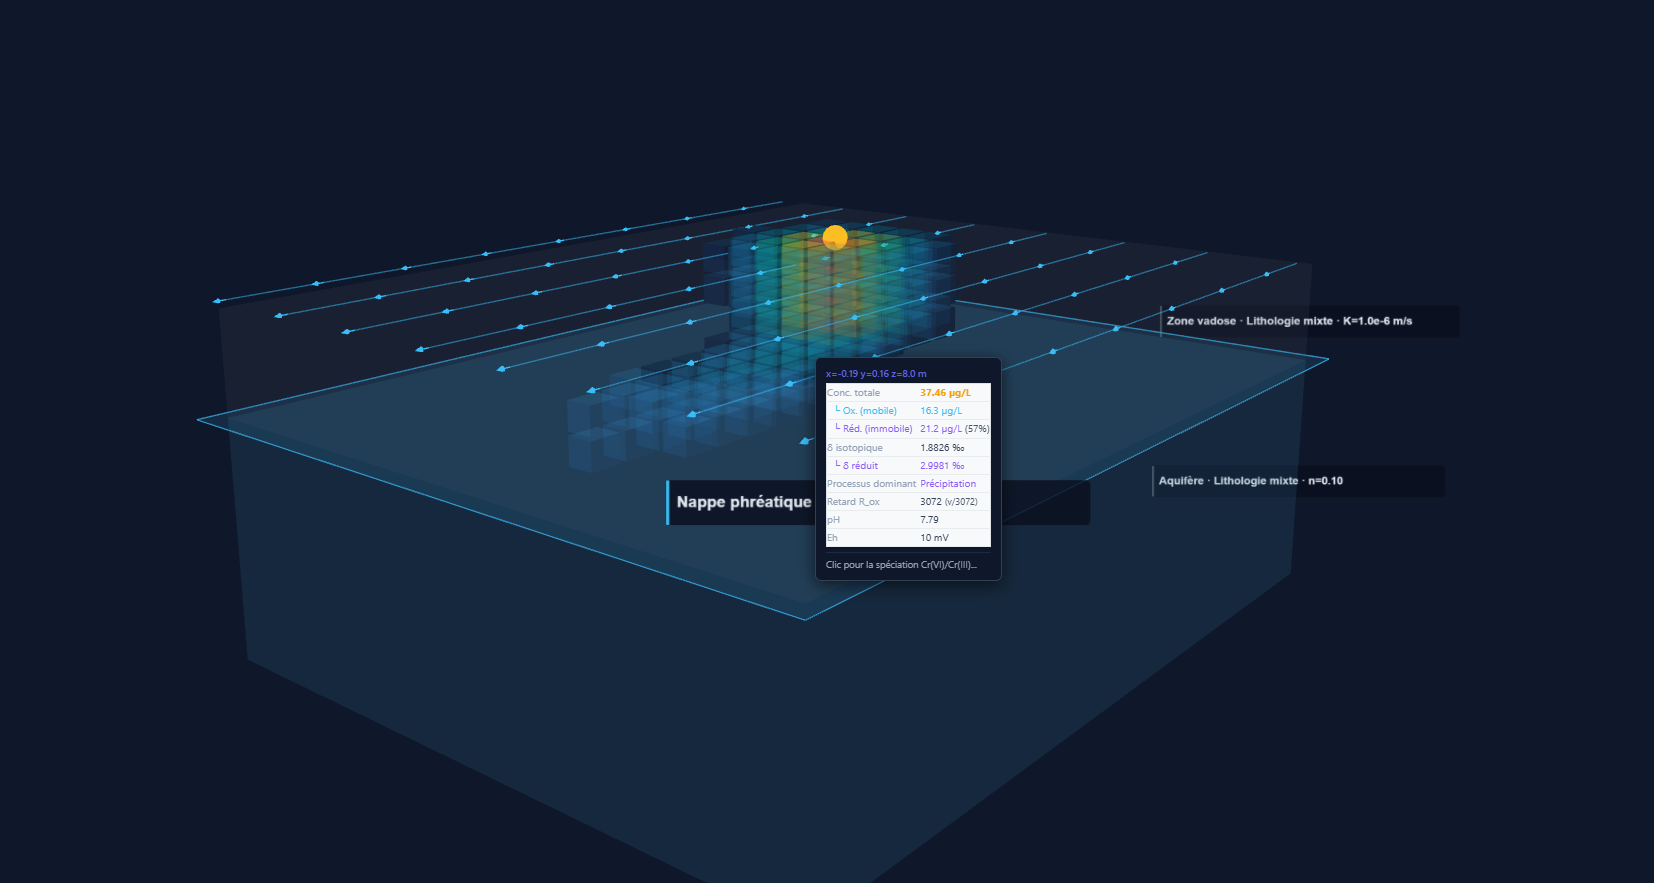
Free navigation in the volume · horizontal cross-section · isotopic tooltip on click
3D modelling does not merely simplify data reading. It makes predictions actionable by enabling navigation through the space and time of contamination.
Isotopically constrained spatio-temporal simulation answers questions that classical investigations cannot address.
Anticipate the arrival of a contaminant at a drinking water borehole or agricultural well. Estimate the impact timeline and expected concentration to decide whether operation should be adjusted before detection.
Rapidly assess the impact of a leak or industrial incident. Simulate propagation scenarios in minutes to guide initial containment decisions and inform authorities.
Identify the zones that genuinely contribute to the contaminant flux rather than treating the entire site. Focus remediation resources on sectors with measurable high impact.
Demonstrate impacts deferred in time and space with a simulation grounded in measured data and published equations. Produce legally enforceable concentration/time curves for each sensitive receptor.
A representative example of the type of investigation that isotopically constrained simulation makes possible.
The simulation enabled a shift from a reactive posture (waiting for detection at the abstraction point) to a preventive one (intervention 14 months before impact), with an estimated remediation cost 4 times lower than post-contamination treatment.
The combination of isotopy + spatio-temporal simulation does not exist in classical environmental investigation tools.
Hydrogeological modelling software ignores isotopes. Isotopic software does not simulate transport. IsoFind combines both in a unified workflow, without data export between tools.
Transport models without isotopic constraints have uncertainties that grow exponentially over time. Isotopic signatures reduce the space of possible scenarios and anchor the simulation in measured observations.
Classical isotopy answers "where does this pollutant come from?". IsoFind answers "where will it be in 18 months and at what concentration?". This is a change of register, not an incremental improvement.
The 3D interface, time slider and contextual tooltips allow a decision-maker, lawyer or site manager to understand and use the results without training in isotopic geochemistry.
IsoFind provides isotopic tracing and 3D simulation for PFAS and pesticides free of charge, without a licence, without commitment.
Full access to the simulation engine for PFAS and pesticide investigations: volumetric 3D reconstruction, temporal simulation, CSIA isotopic constraints and basic Nexus fractionations.
Chlorinated solvents, redox metals, hydrocarbons, mining sites, with the ML ONNX engine, full Nexus fractionations and detailed speciation on click.
Import your well data, define your sensitive receptors and get your first concentration/time curve in minutes. Free for PFAS and pesticides, no commitment.